
Learn how to install and use Piny.
DocsPinyDocsPiny2025-06-02
Piny
Installation
Piny is an extension for Visual Studio Code, Cursor, Windsurf and other IDEs based on Visual Studio Code.
Open the Extensions panel and search for Piny, then install the extension.
Keep Update checked so you always have the latest version.
Piny requires that at least one folder is open in the editor Workspace. Otherwise Piny will not open and an error message is shown.
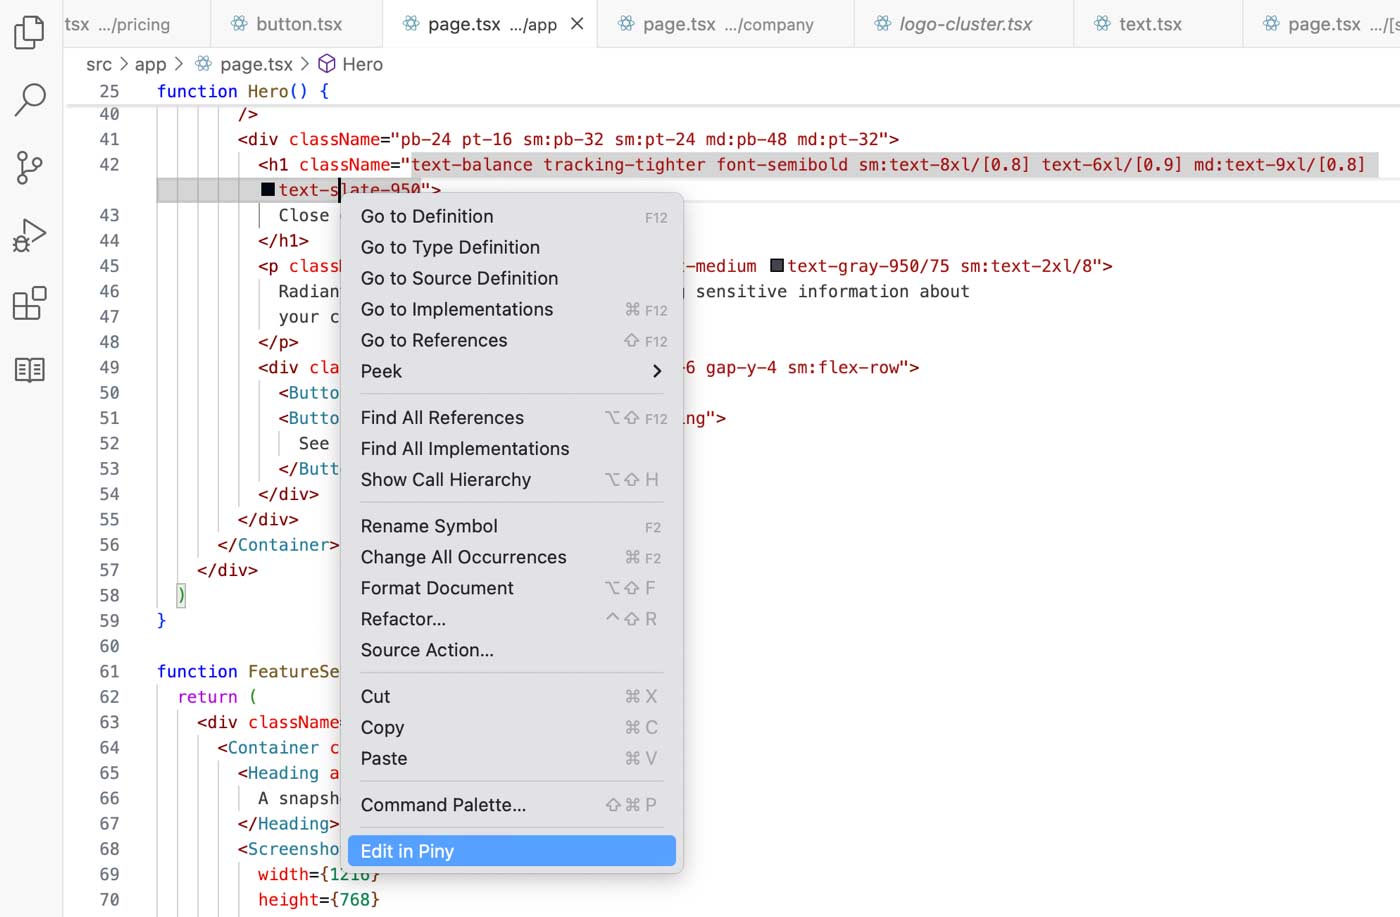
To open Piny, right-click anywhere in the code and choose Edit in Piny.
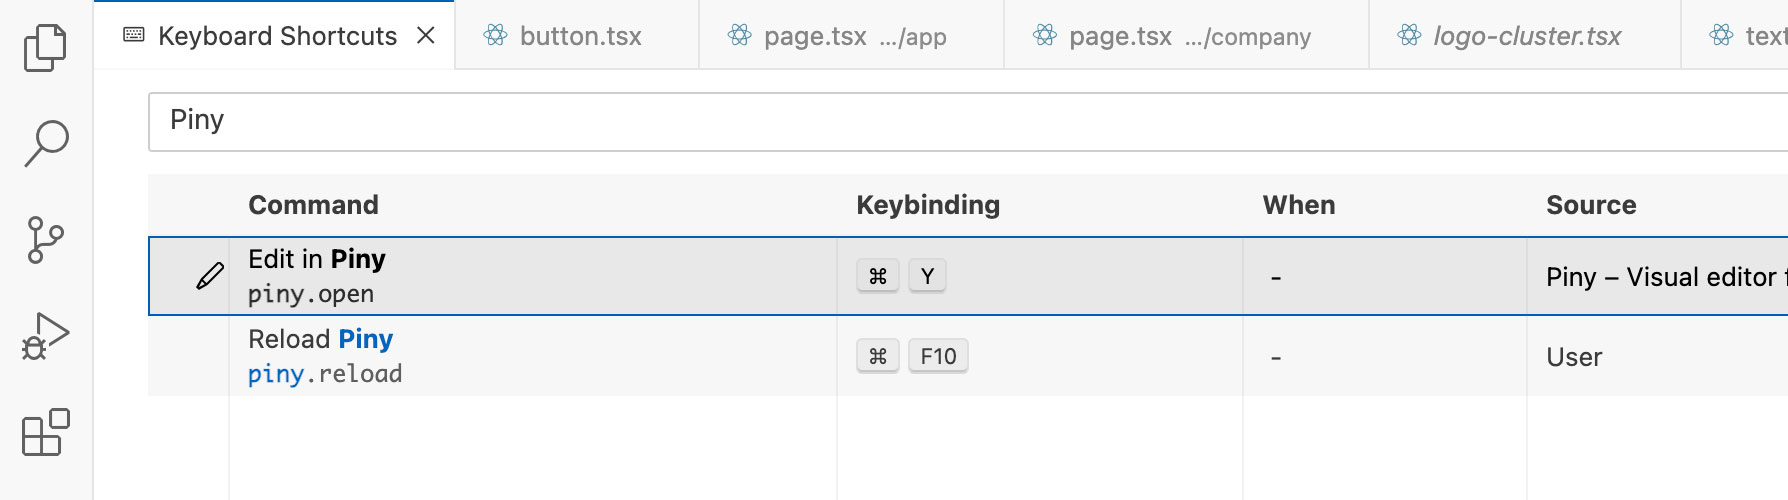
Use Visual Studio Code settings to assign a keyboard shortcut to that command.
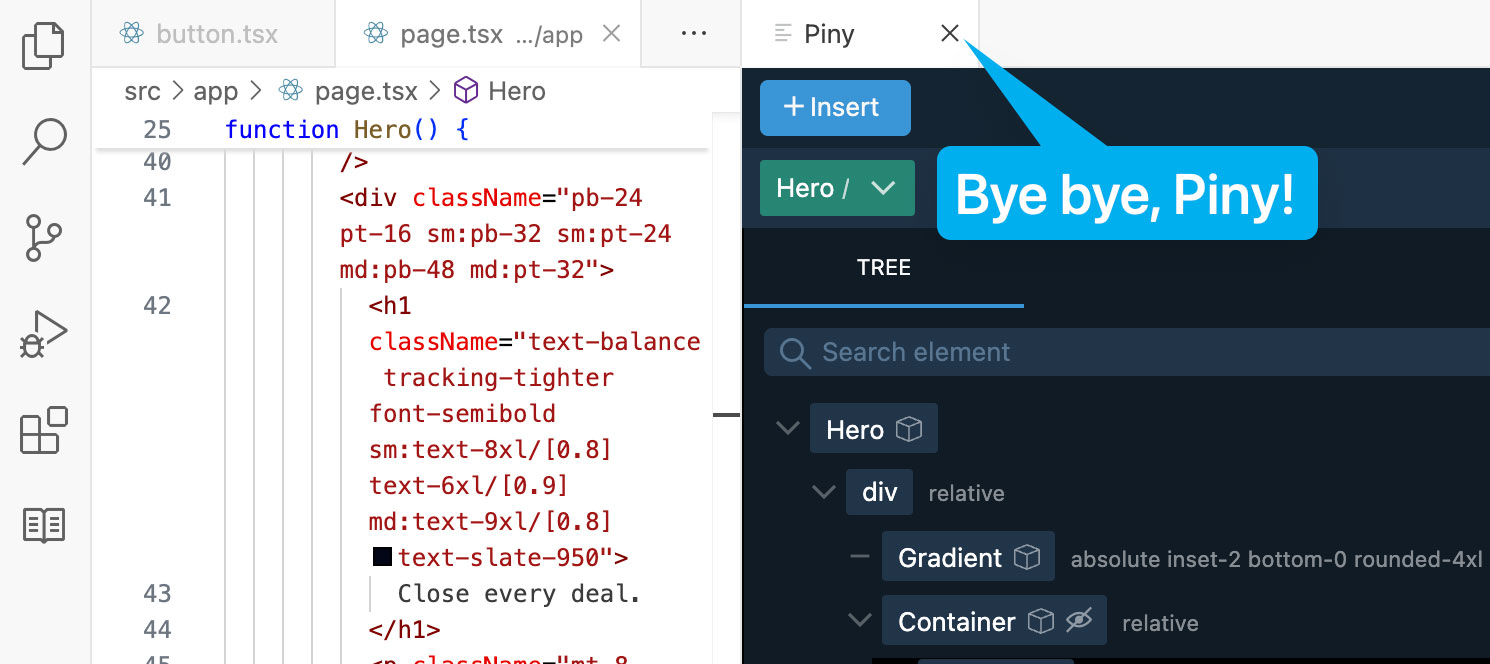
You can freely switch away from the Piny tab - the editor state is preserved. Close the tab when you’re done; reopen it any time with Edit in Piny.
Preview
Piny shows a responsive browser preview of your project.
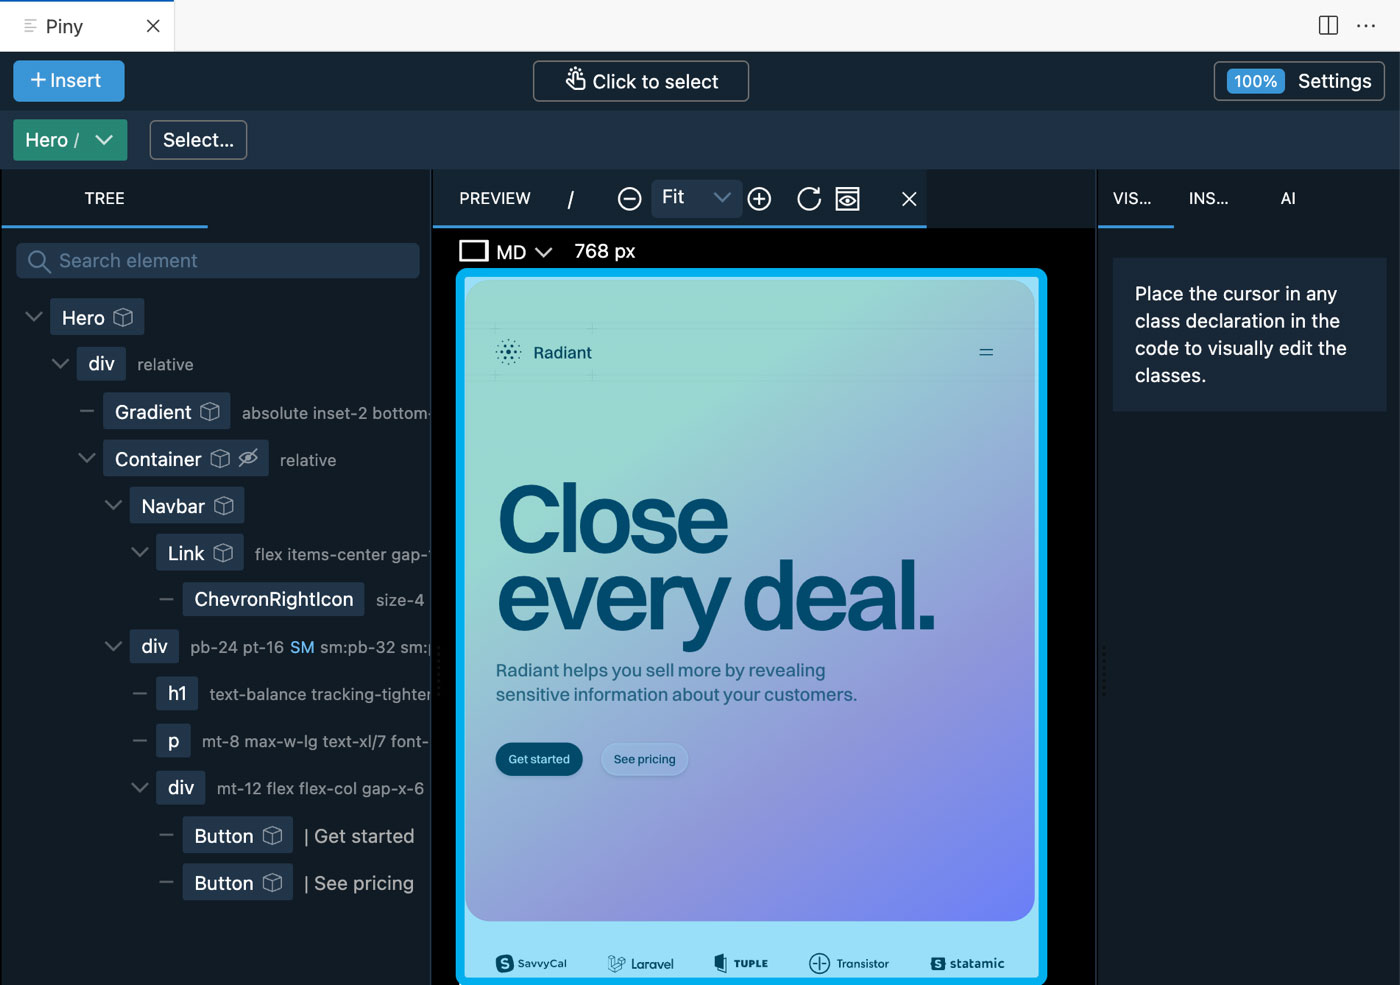
Use the route dropdown to add and select a route displayed in the preview.
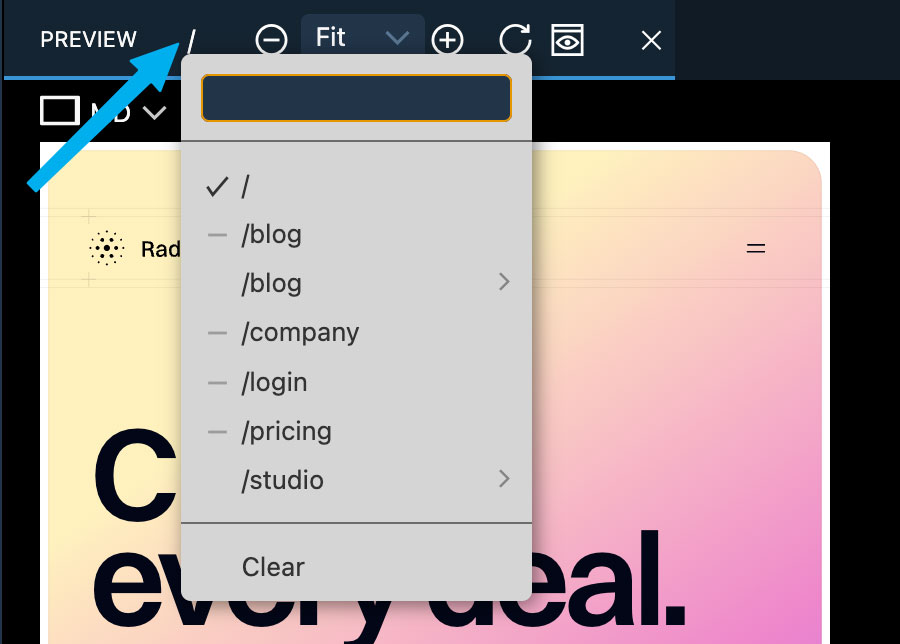
Piny Pro: when Visual Select is active, Piny tracks visited routes and lists them in the route menu.
If you don’t need the preview, hide it with the icon in the preview toolbar.
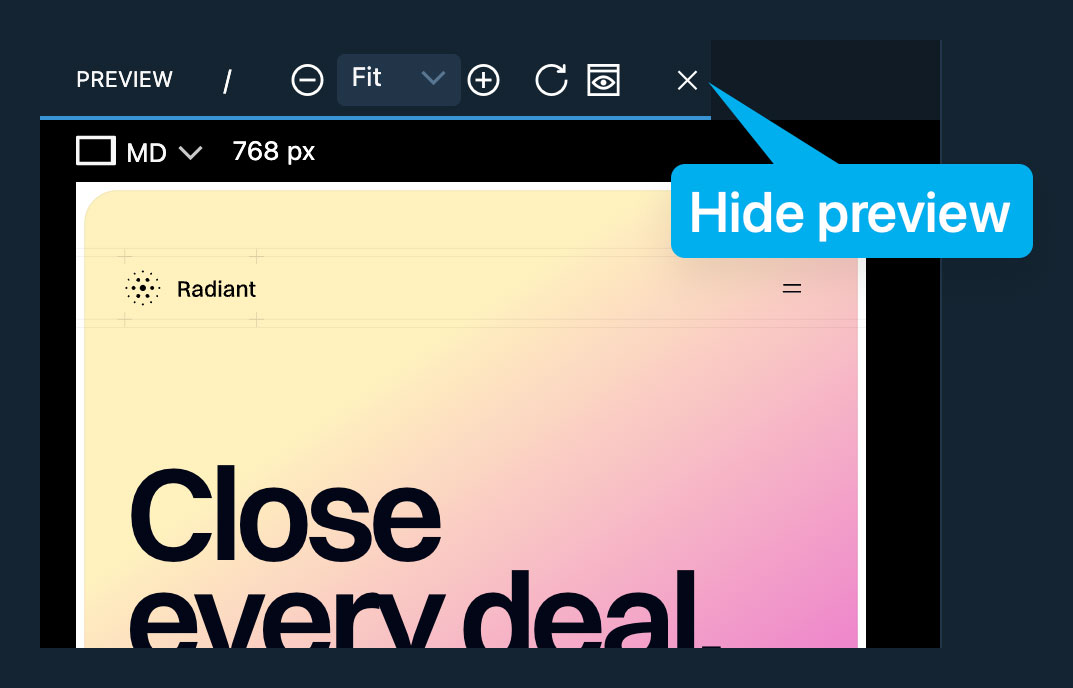
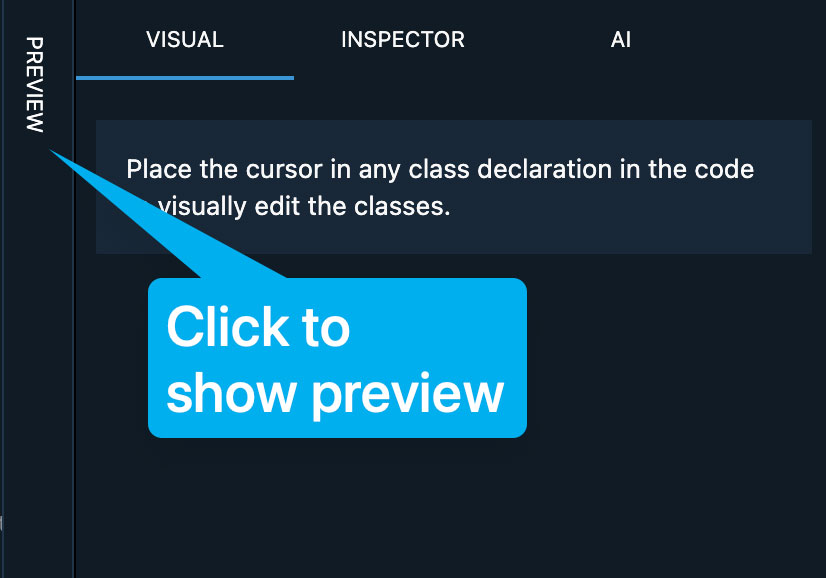
To get it back click on the collapsed Preview.
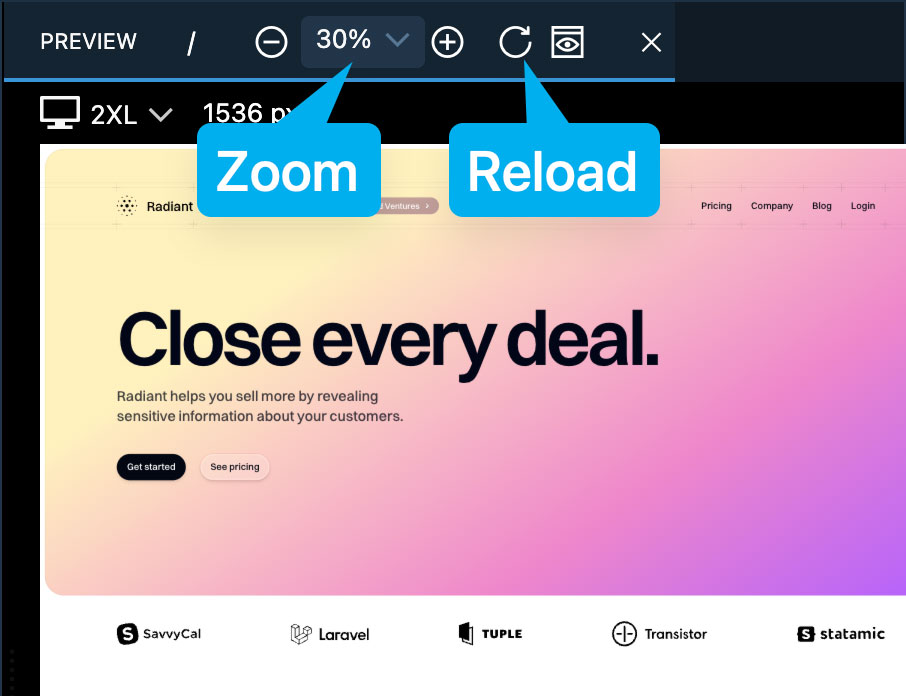
In the Preview toolbar you can also set the zoom level and reload the preview.
Selecting Components and Elements
One component can be edited at a time. Its JSX structure appears in the Tree panel.
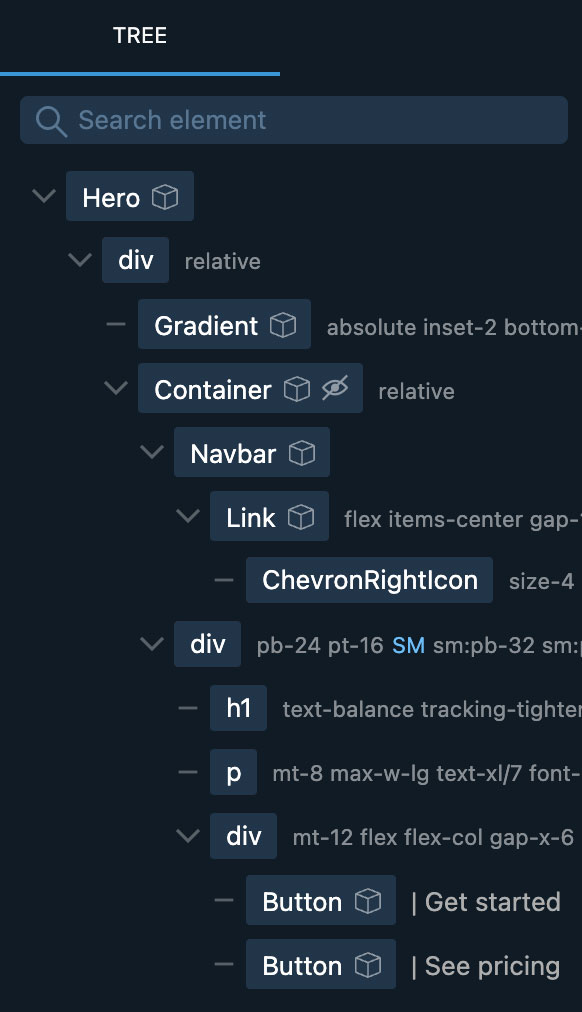
Select a JSX element or string in one of three ways:
Place the cursor in the code (the element under the cursor is selected) or click the element in the Tree panel.
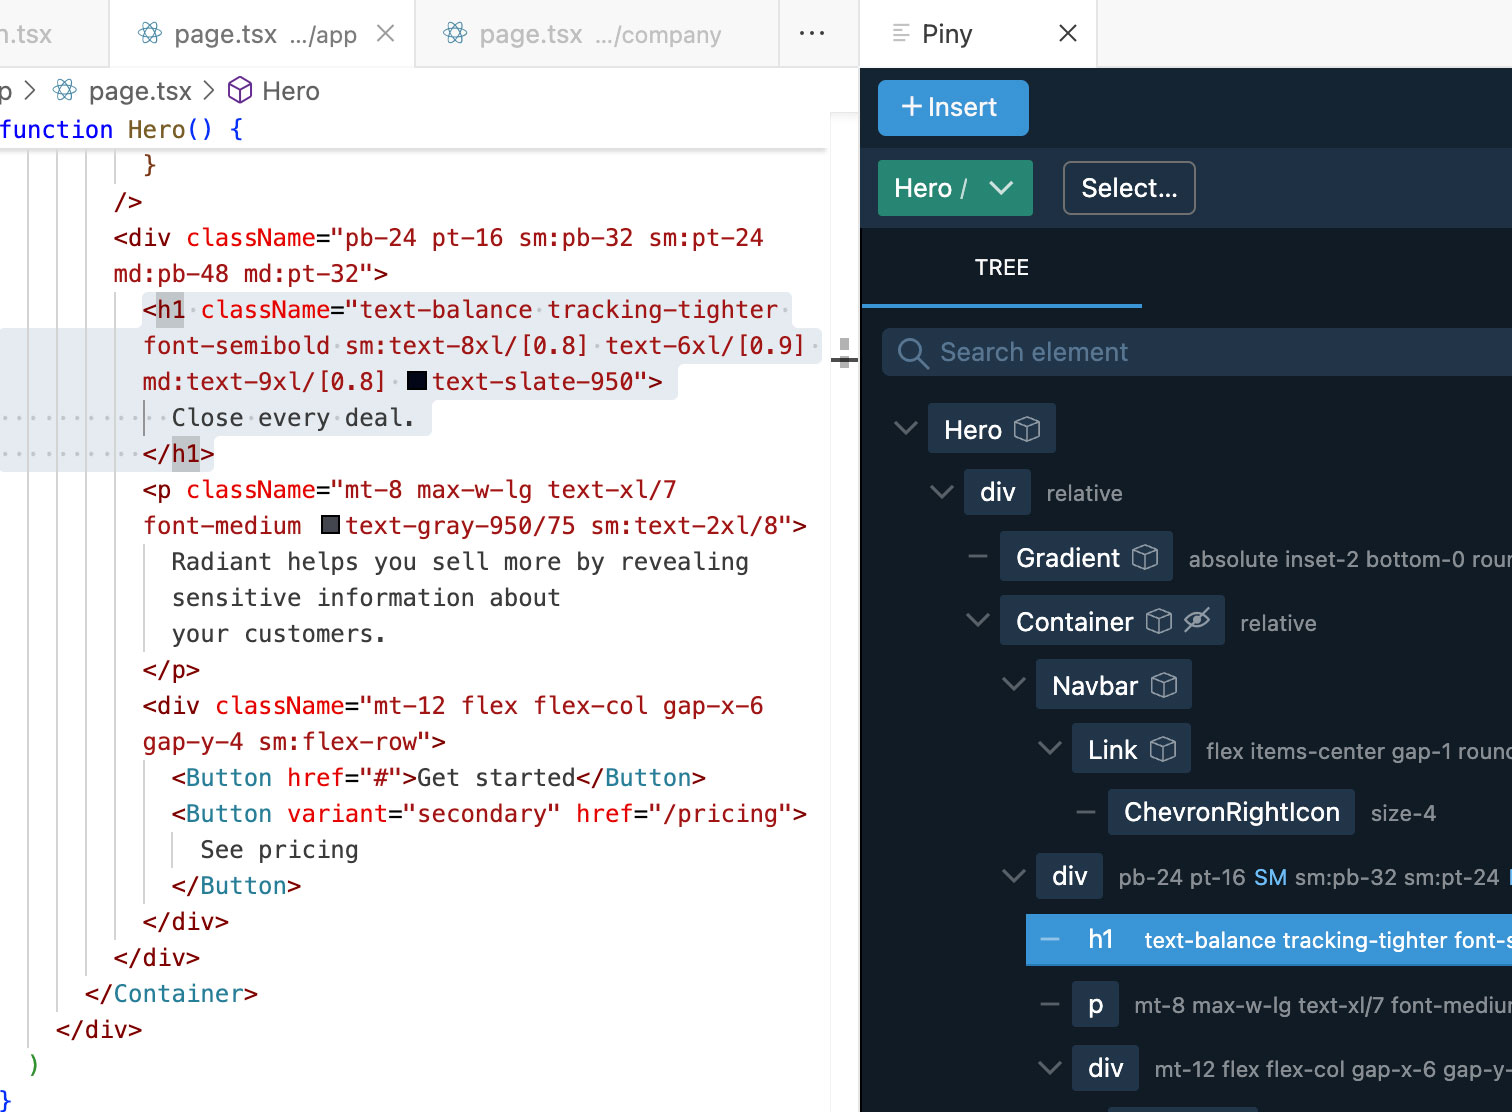
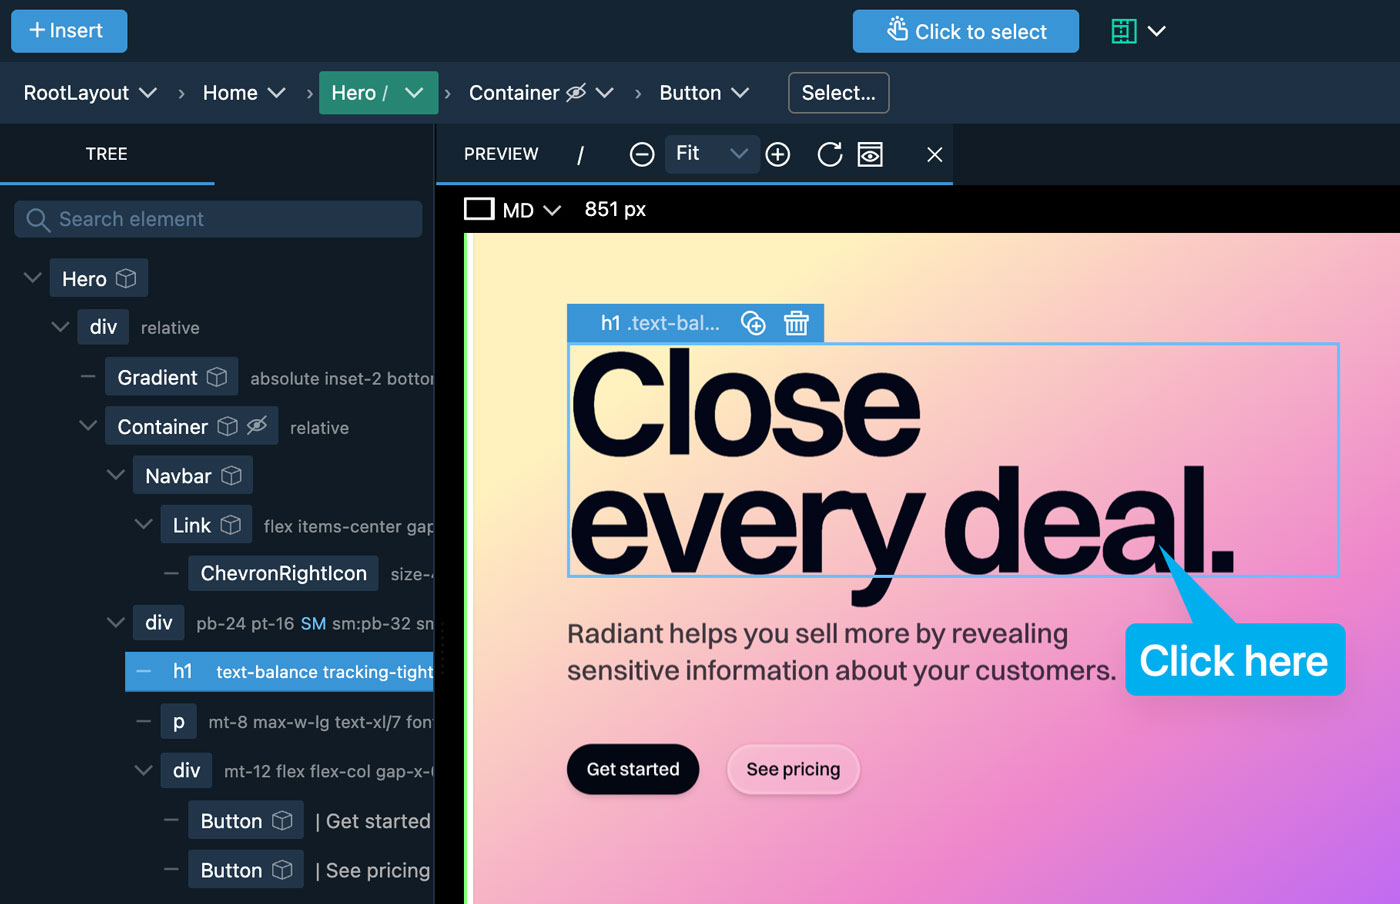
Use Visual Select (Piny Pro) to click elements directly in the preview.
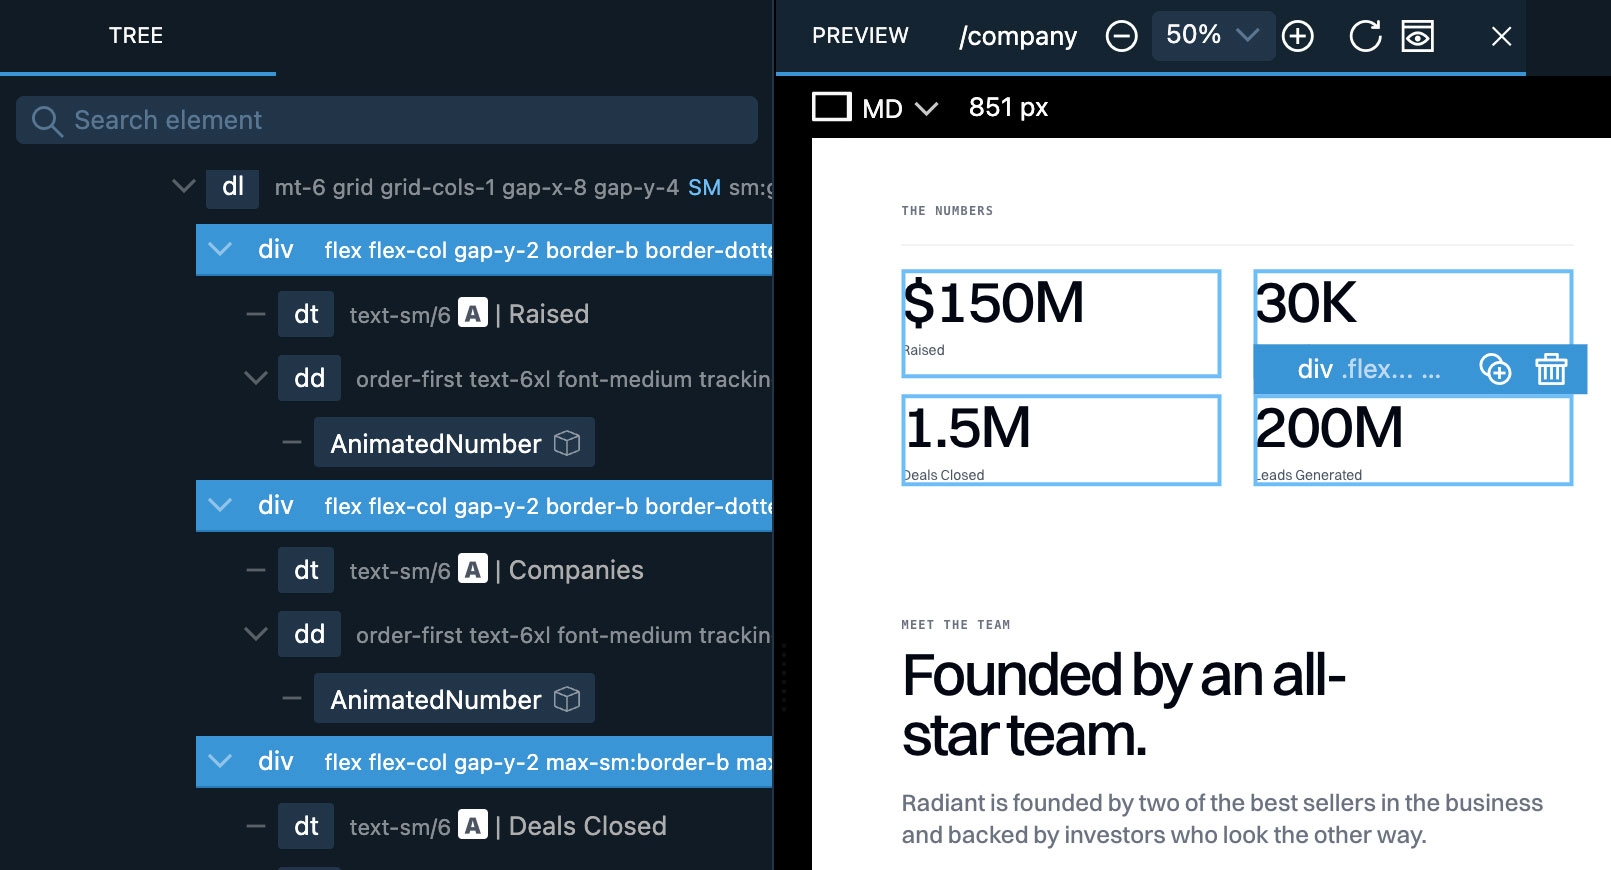
With Piny Pro you can multi-select elements: Ctrl/Cmd + Click to add or remove, Shift + Click to select a range.
If the cursor is inside a string (for example a class list), a special “Code” element is selected; you can still edit Tailwind classes via Visual Controls and Inspector.
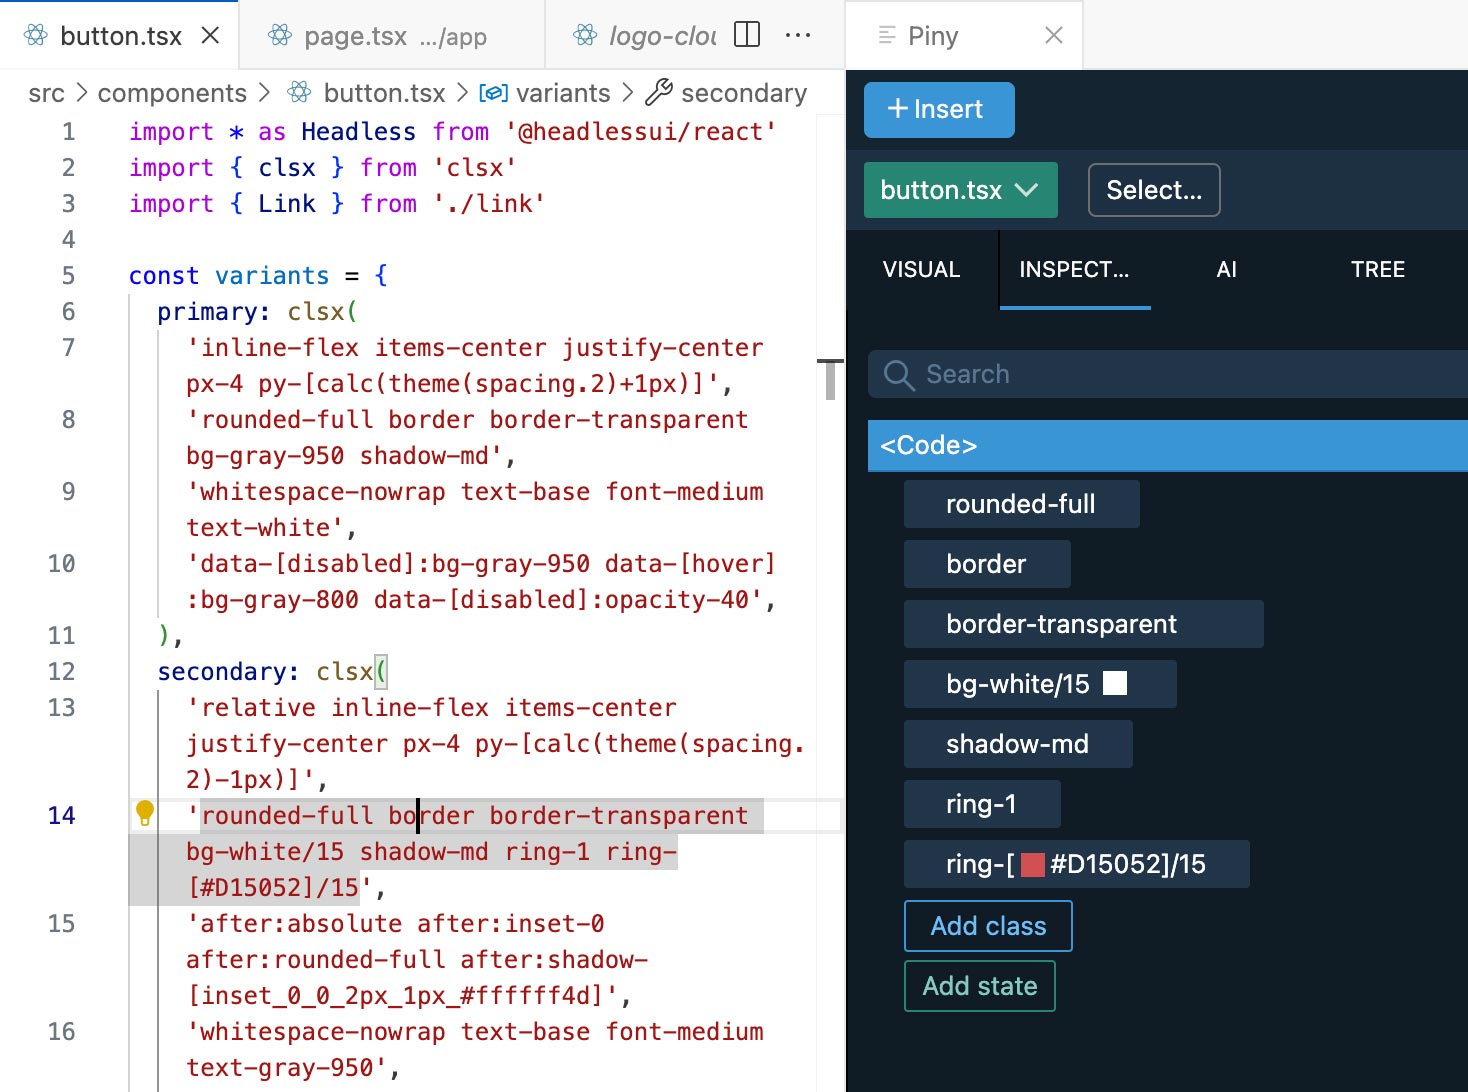
Visual Controls
Visual Controls let you edit Tailwind styling for the selected element.
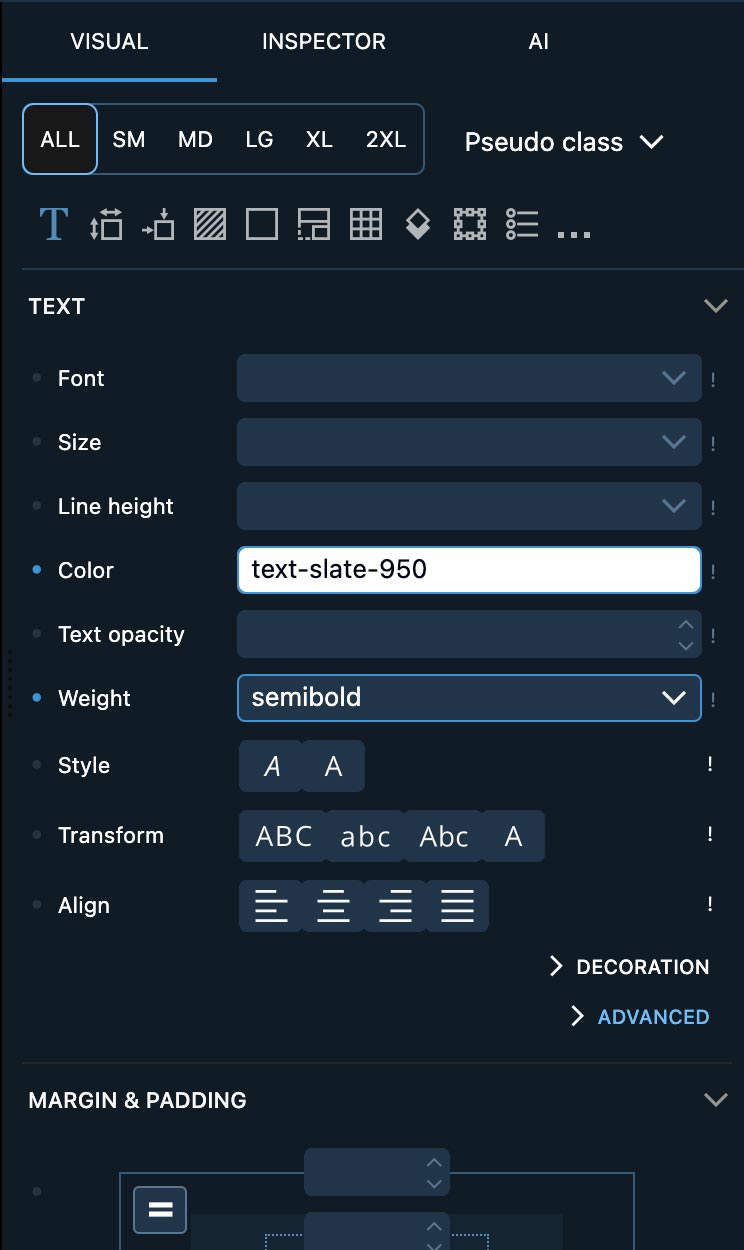
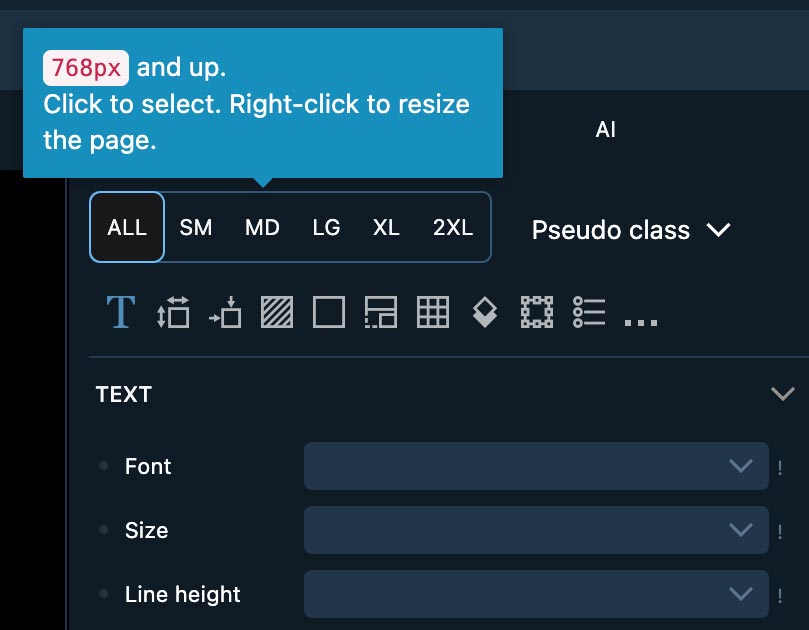
Choose a screen-size tab (right-click to also resize the preview).
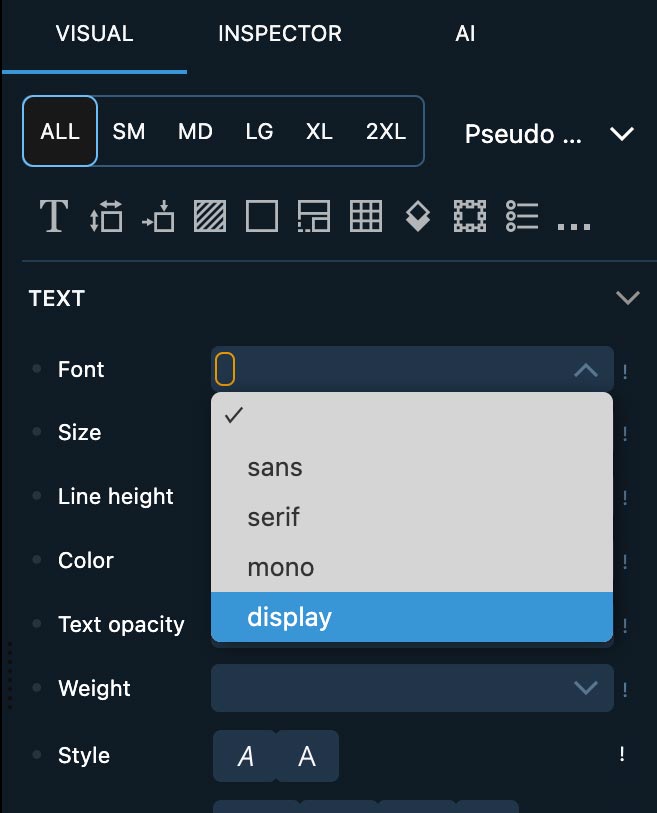
Use the States dropdown to pick a state (hover, focus, active…).
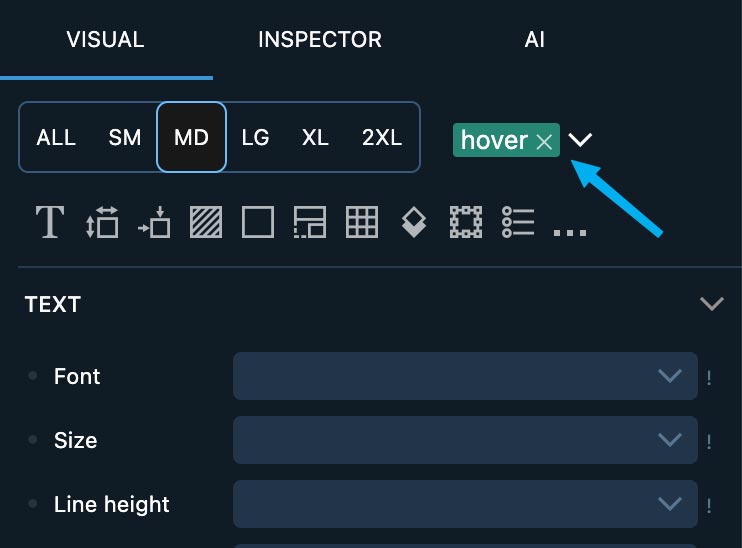
This opens up the states menu:
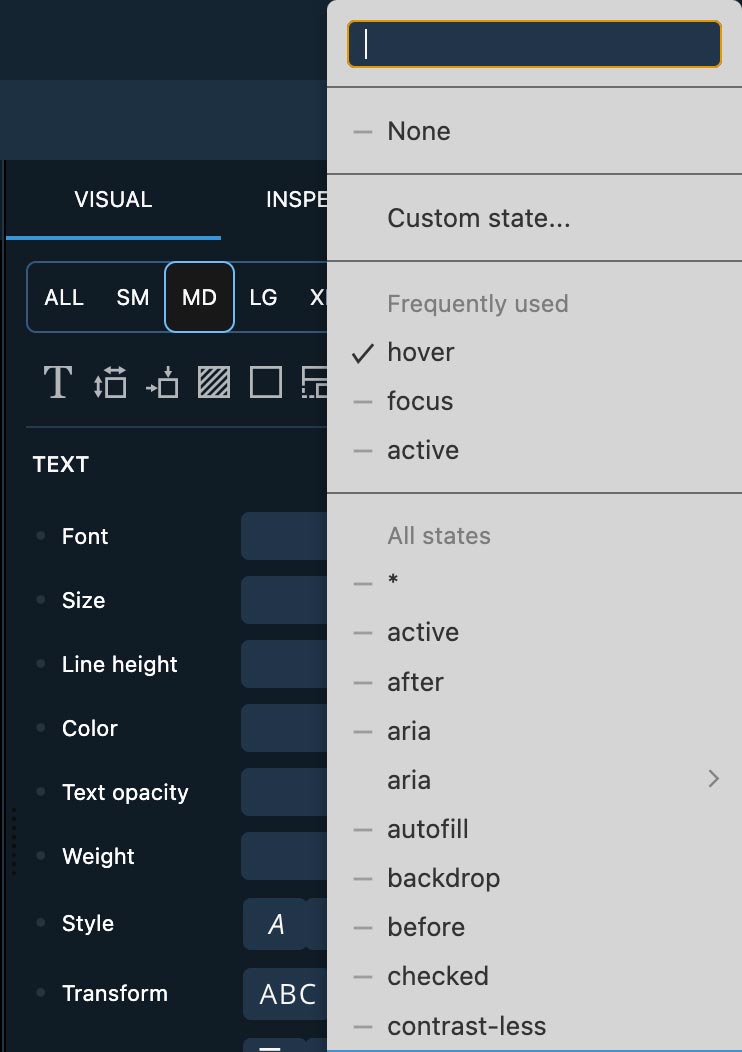
Your edits apply to the current size × state combination. Changes are written straight to code and saved automatically; rely on git and Undo to discard unwanted edits.
For complex combinations, use the Inspector.
Inspector
Inspector shows Tailwind classes of the selected element and its parents in an editable tree - ideal for visualizing and tweaking complex styles.
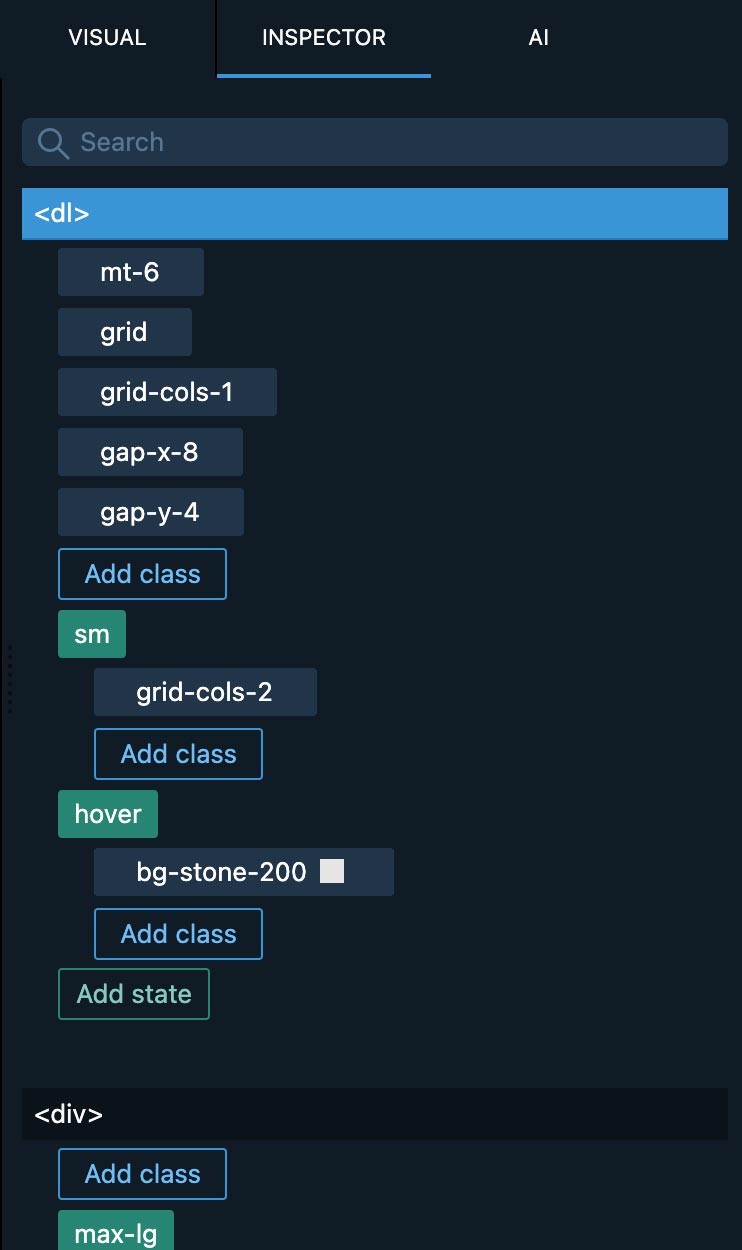
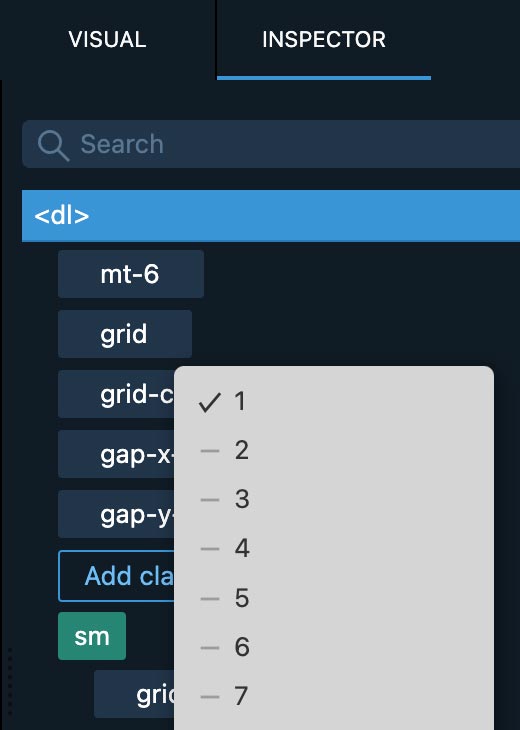
Click a class to change its value.
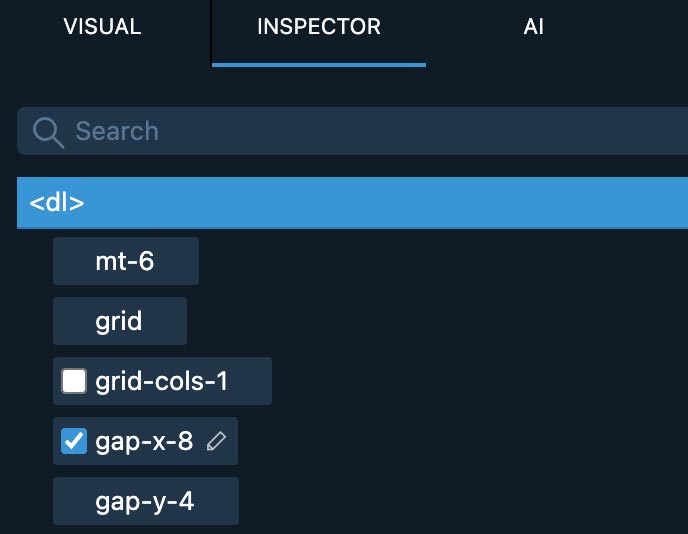
Uncheck the class to toggle visibility.
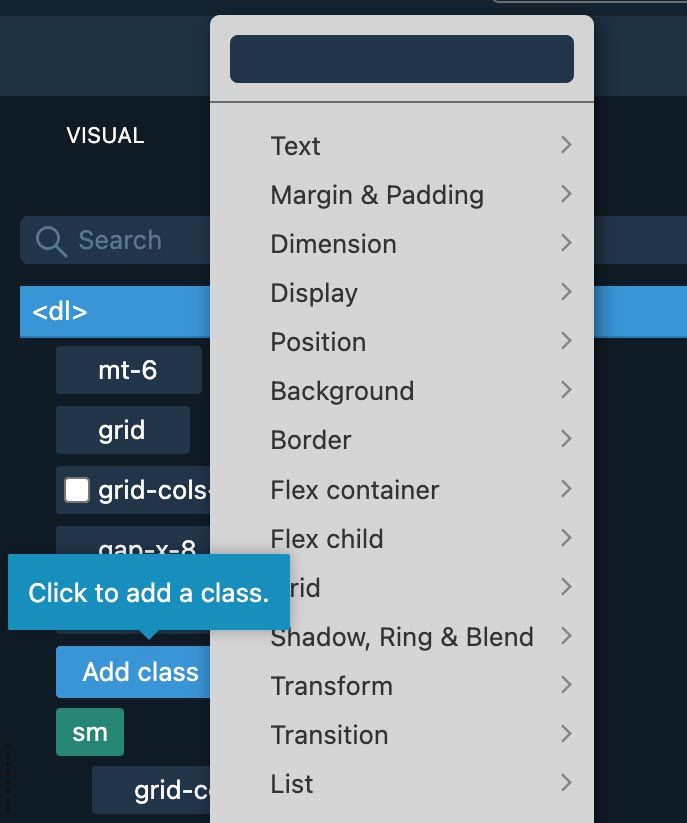
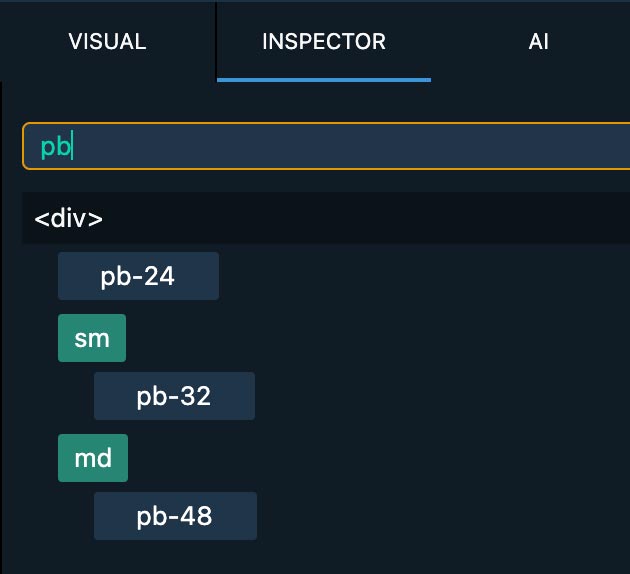
Add classes or states from the menus or with smart search.
Add states with the states menu.
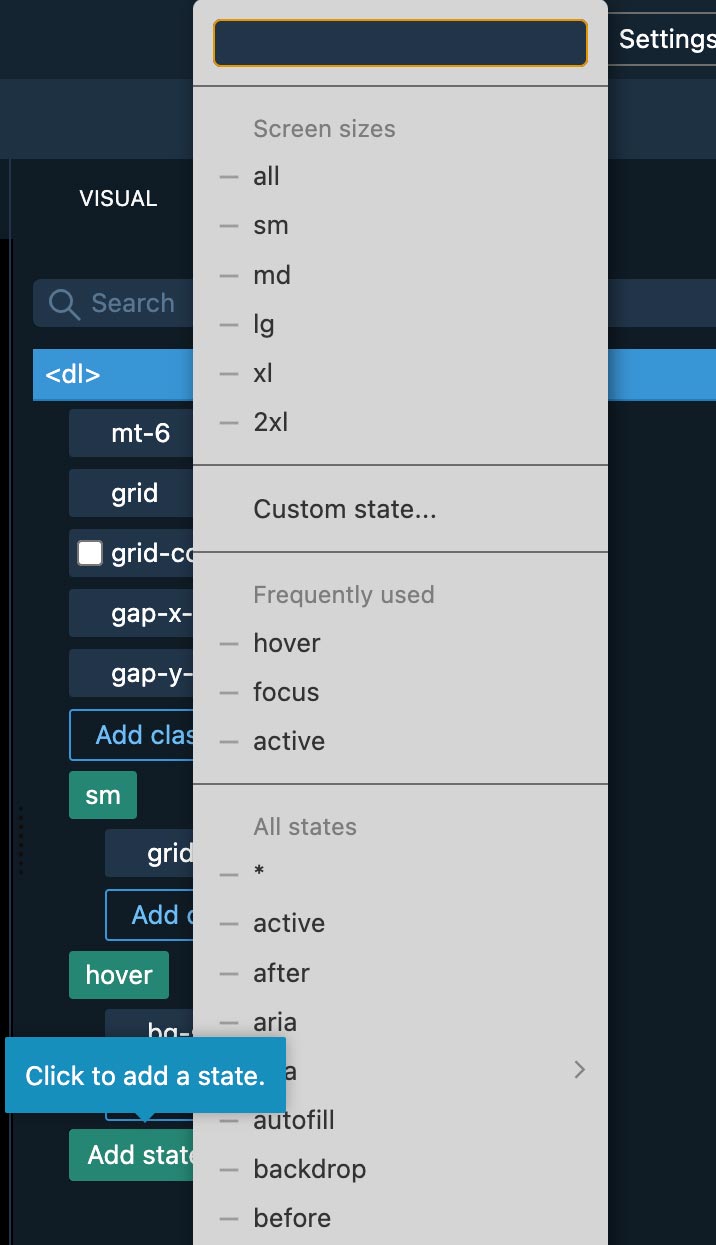
Click on states to edit them. Selecting a different state will combine the original state with the selected state (unless you are selecting a different screen size).
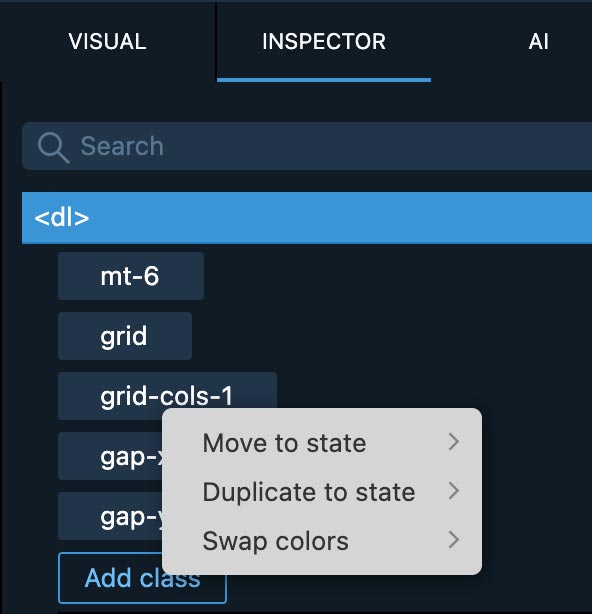
Right-click classes to move or duplicate them to another state; duplicate is handy for responsive overrides.
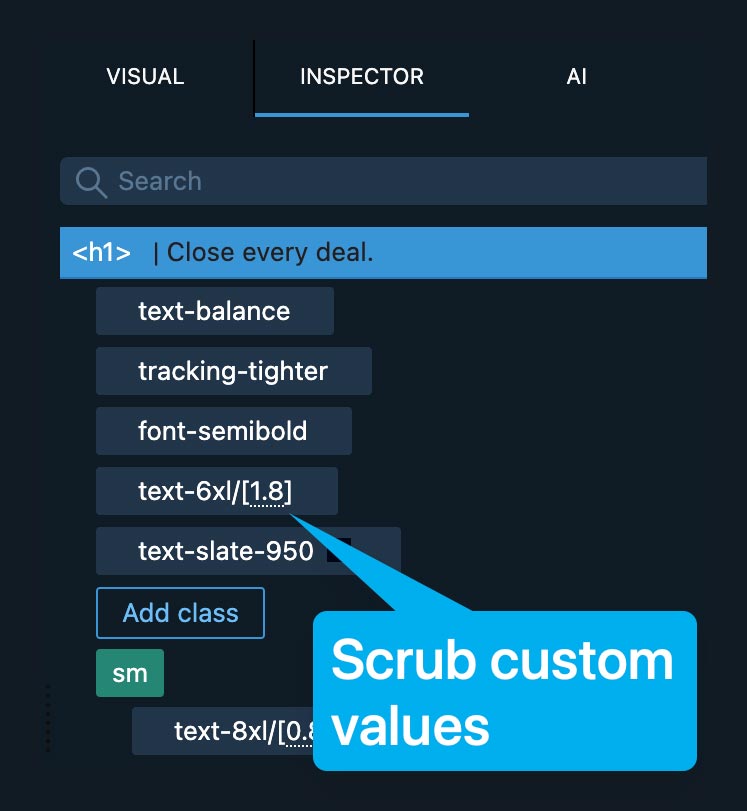
Drag numeric sliders or use the color picker for custom values.
Narrow down properties with the search bar.
Components Bar
The components bar above the preview lets you quickly switch between components.
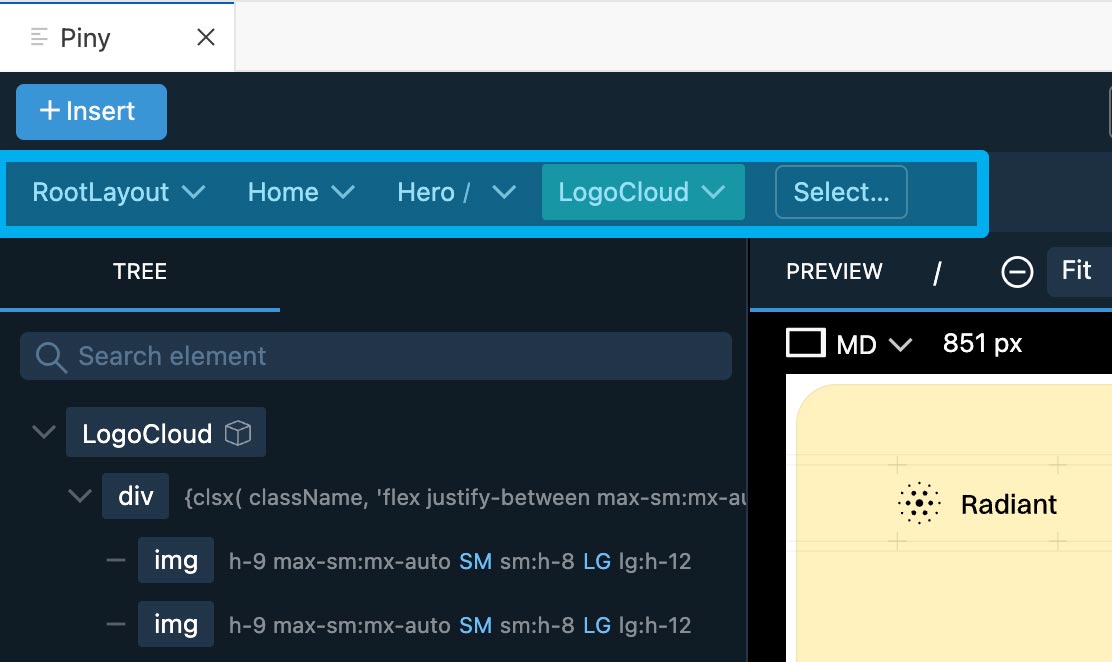
It works in two modes:
- When Visual select is disabled, the bar shows a list of recently viewed components.
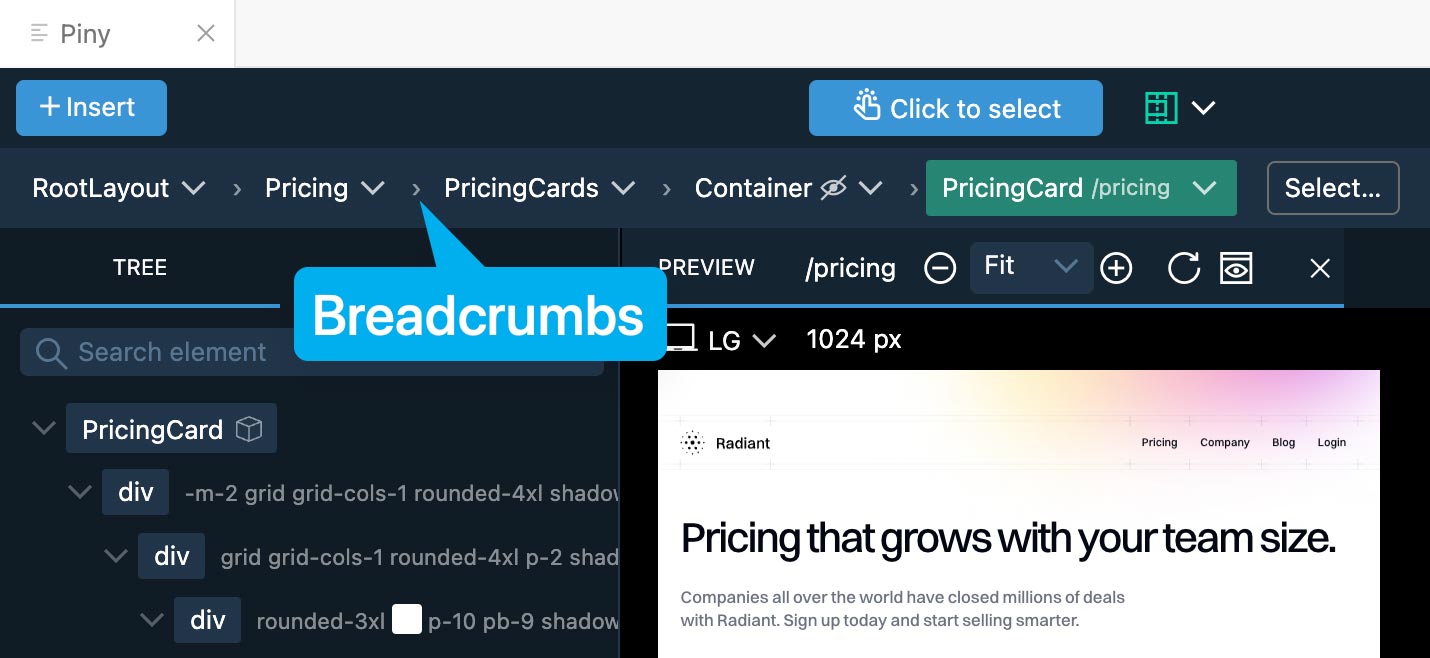
- With Visual select enabled, the bar shows the selected component and its parents, like breadcrumbs.
Click on a component to select it in Piny and in the code.
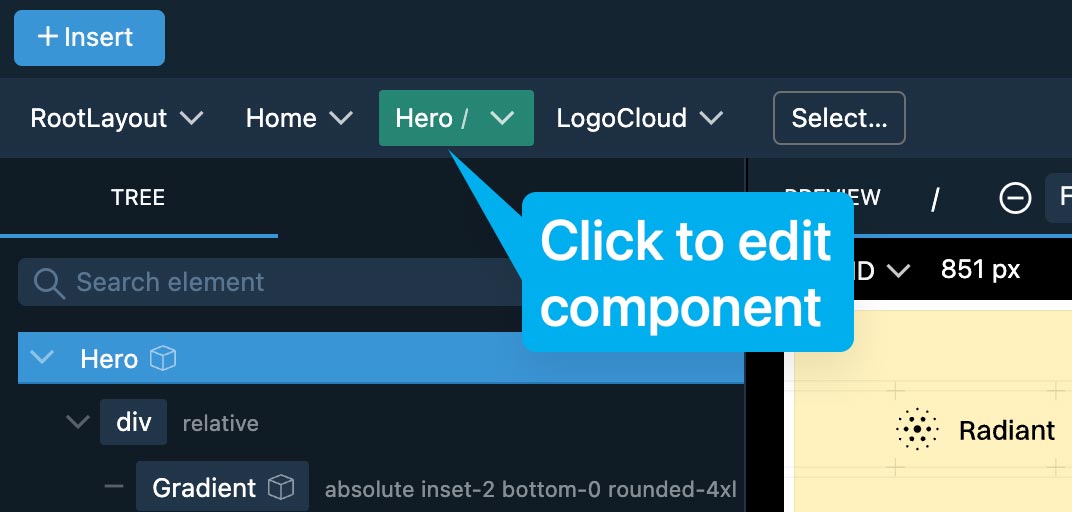
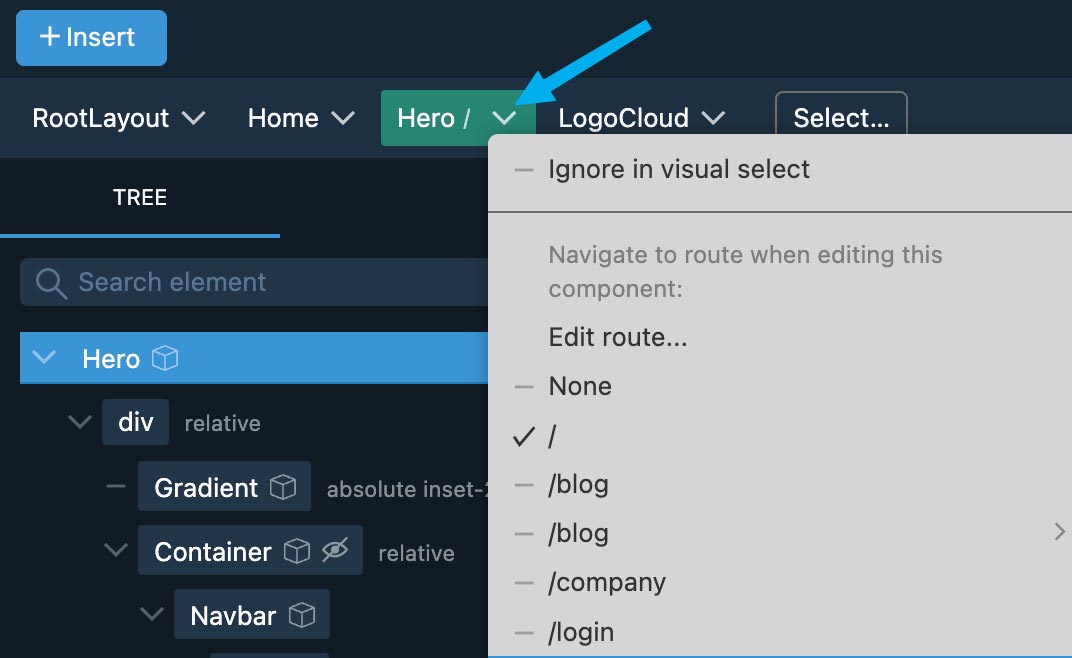
Use the dropdown menu to:
- Ignore the component in Visual select (prevents drilling down into the components, will be explained in detail in the chapter about Visual select).
- Assign a route to the component. Whenever the component will be selected, the preview will show the associated route.
AI Assistant
After activating the AI Assistant in Settings - with your own API key for any OpenAI compatible endpoint - you can use the assistant in two ways:
Drag & Drop
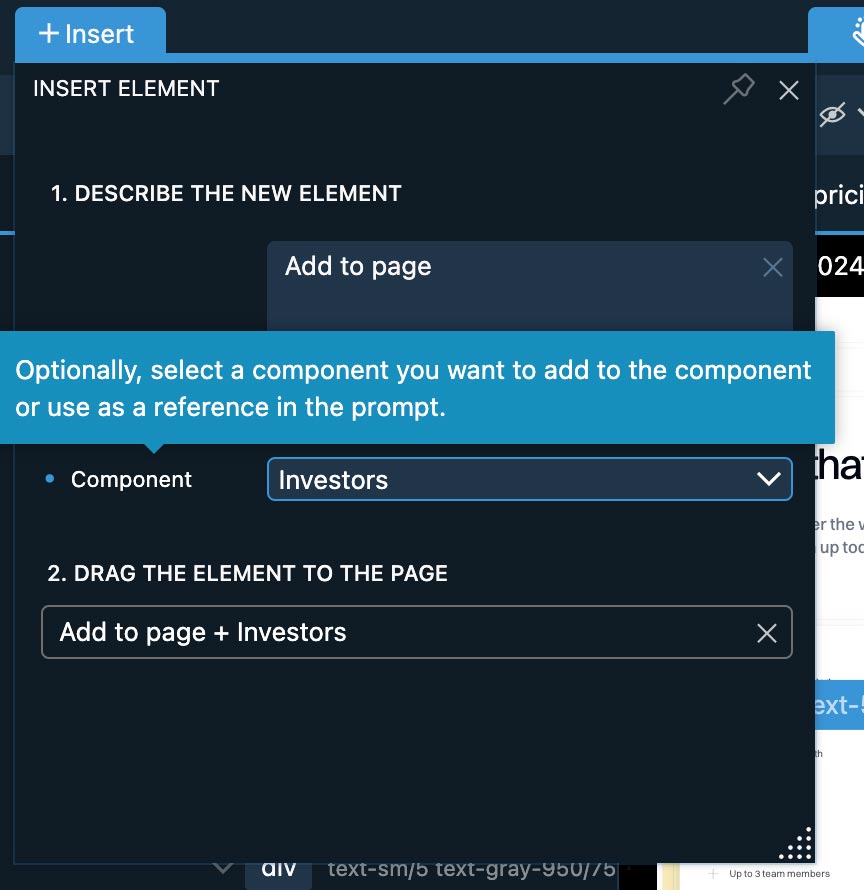
Click on the Insert button to open the insert panel where you describe the feature, optionally select a referenced component, and than drag it to the desired place in the Tree panel.
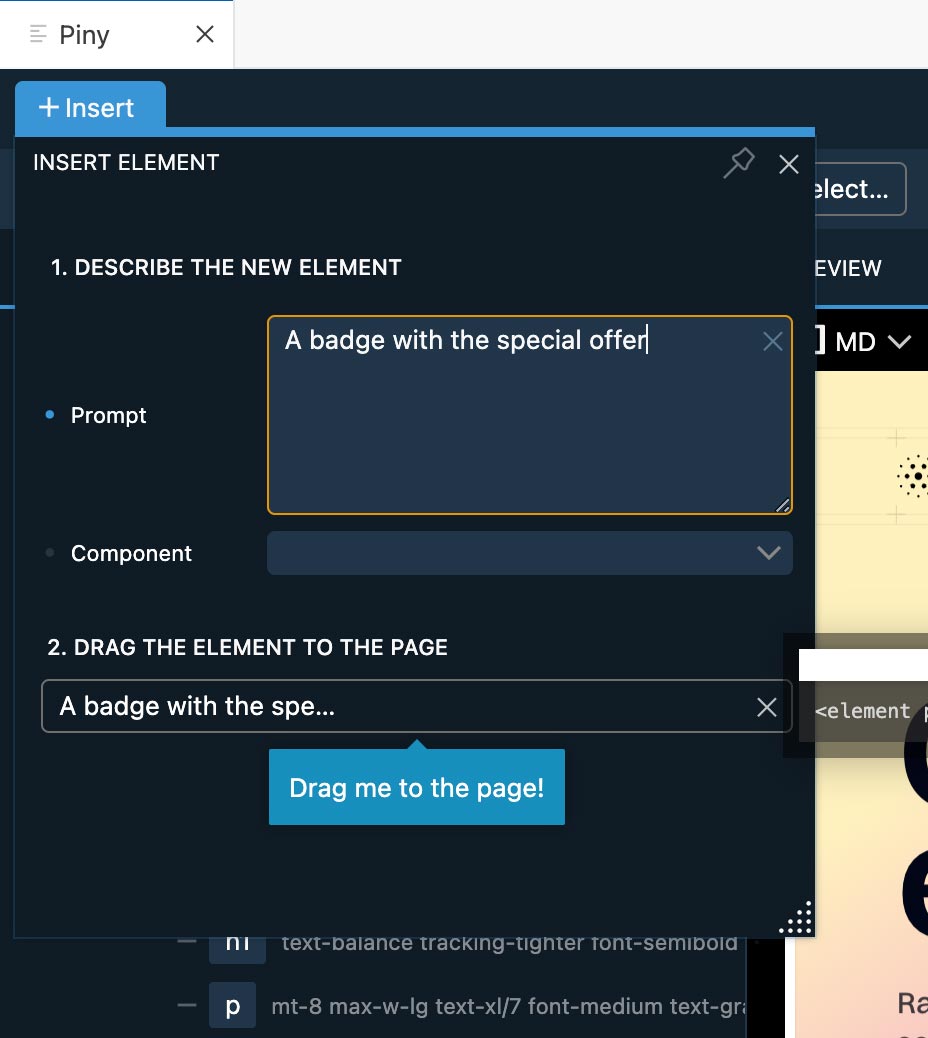
This triggers a command in the AI panel where you can followup with further requests.
AI Panel
Use chat interface to guide the AI Assistant.
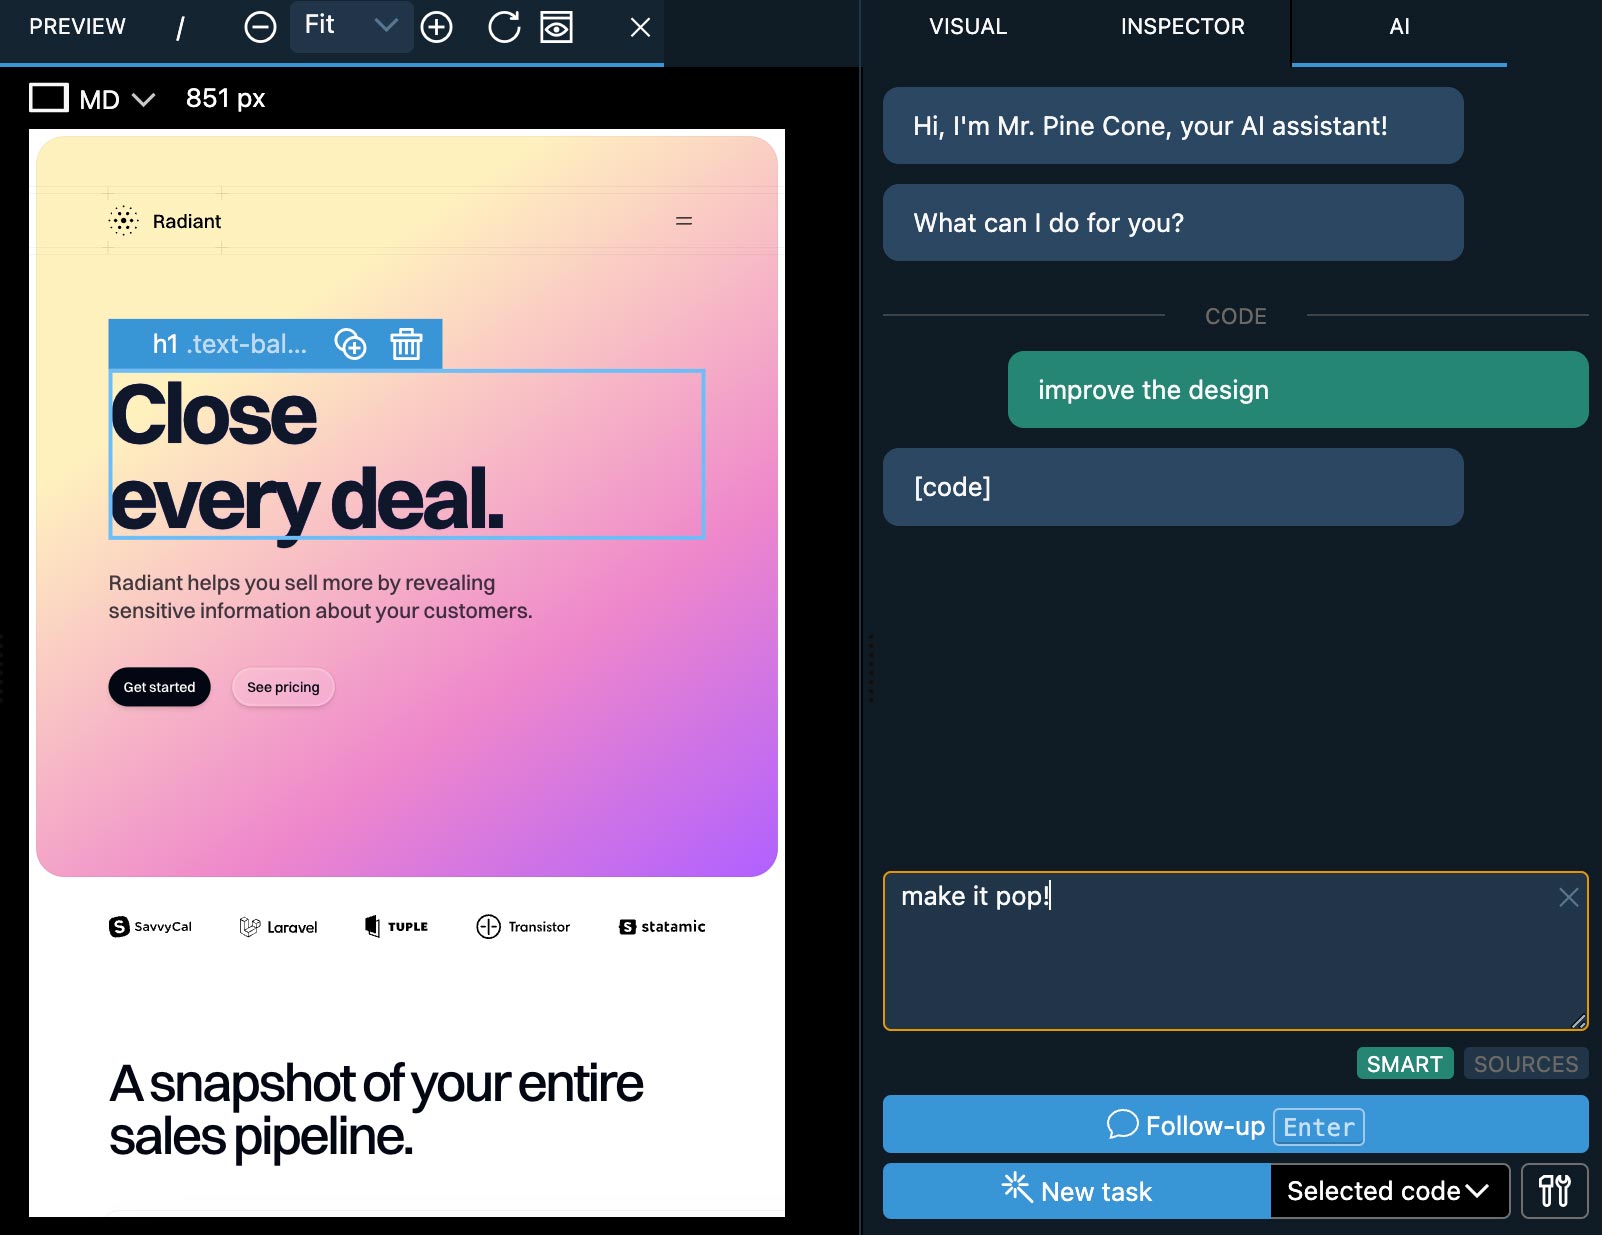
Use one of the available actions:
- Project will do project-wide changes with the ability to read and write multiple files. This action can use up a lot of tokens. Use it for complex tasks such as refactoring components, adding features that span multiple files.
- Selected code transforms only the selected code (or selected JSX element) without getting any context of the surrounding code. It is very cost and time efficient and perfect for styling elements and doing changes that only affect the selected element.
- Just chatting has no effect on the code.
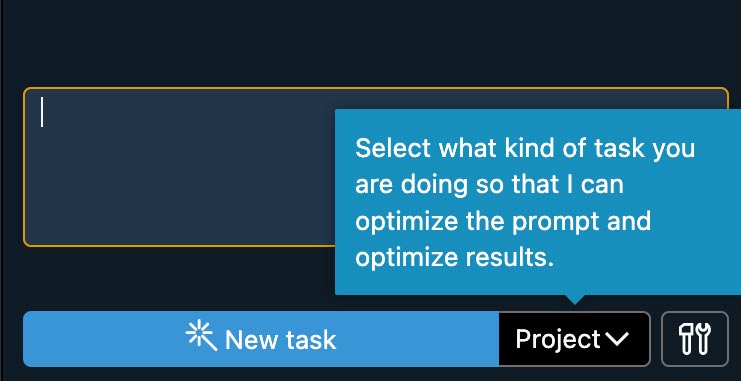
AI Assistant settings let you designate two models as the quick and the smart model.
Use the Smart toggle to quickly switch between them.
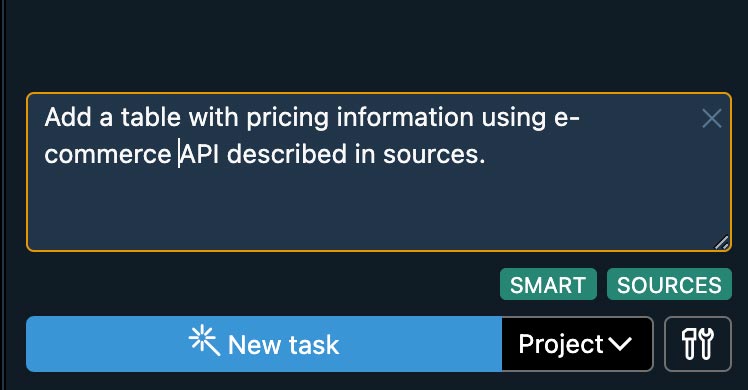
Sources toggle lets you insert one or more knowledge sources into the prompt. Right-click on Sources to manage them.
Visual Select
Click on elements in the preview to select them in Piny and in the code.
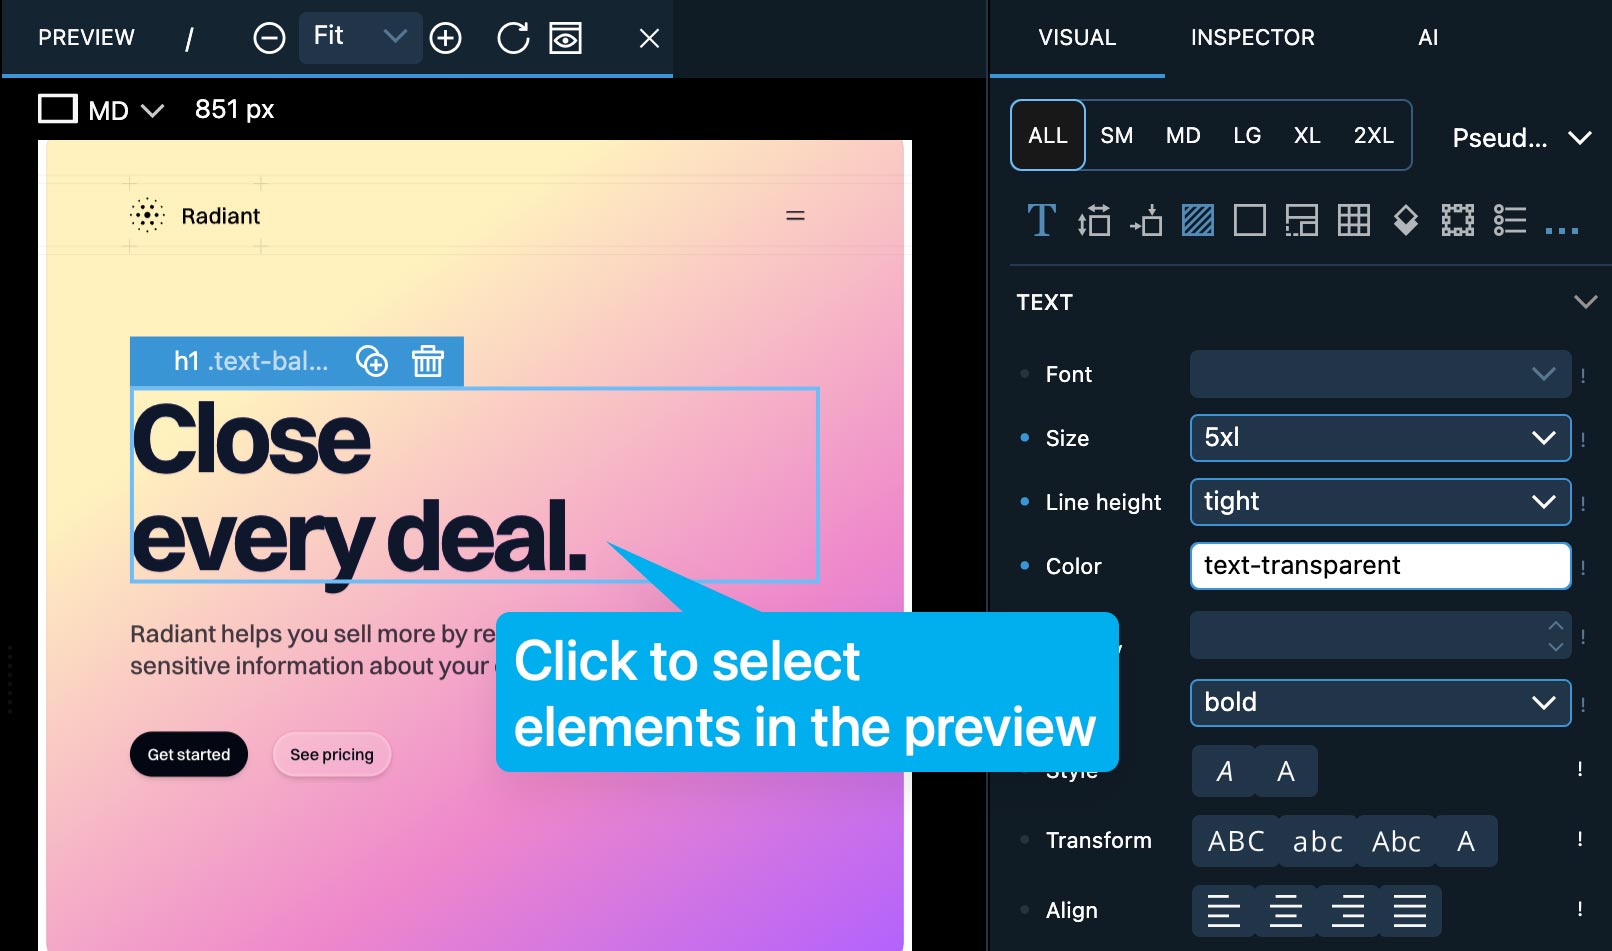
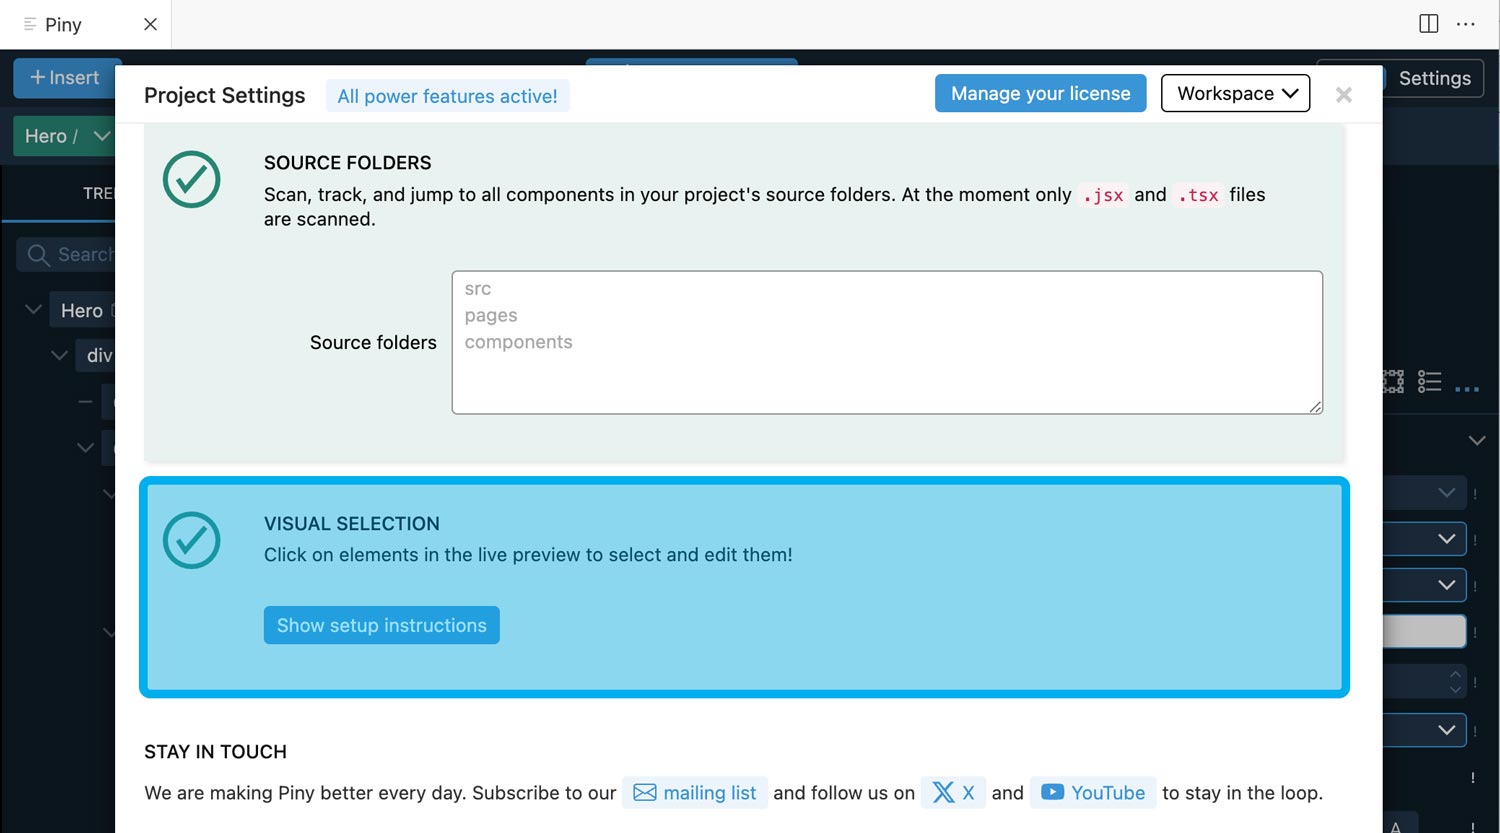
Visual select requires a small script to be inserted into the layout of your project. The script is only inserted in development mode and has no effect unless the project is viewed through Piny.
At the moment React Vite projects and Next.js projects are supported.
Follow the specific instructions provided in Settings to enable Visual select in your project.
Use the Click to Select button to switch between visually selecting elements and interacting with your app.
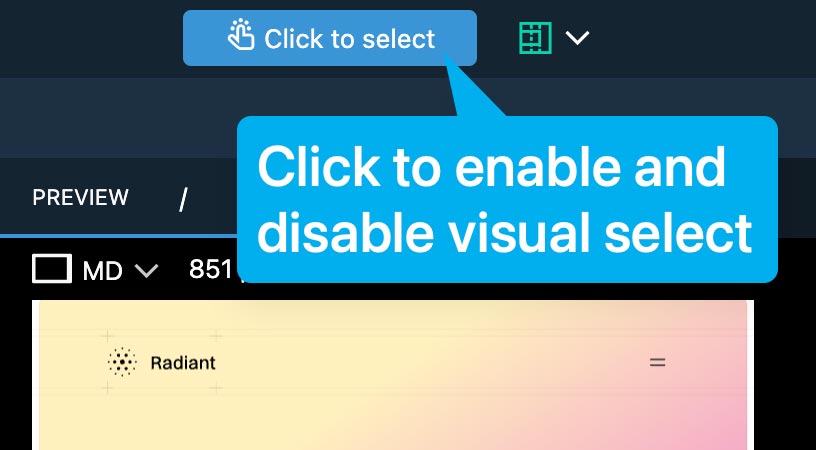
Activating the Click to Select button also refreshes the DOM mapping, so that’s the first thing to try in case of any issues.
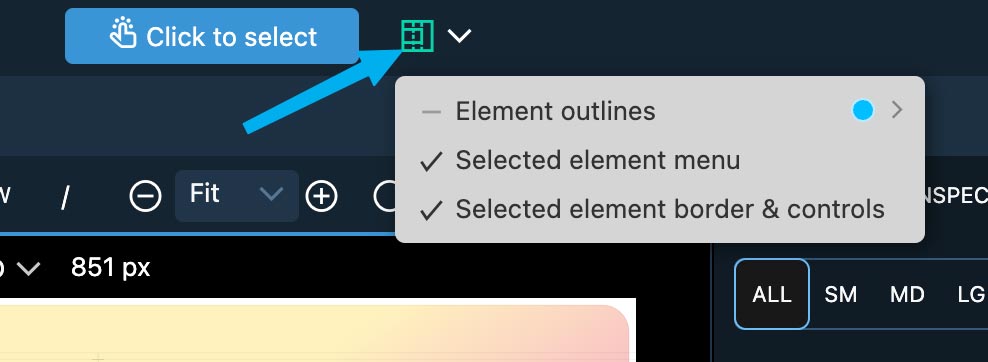
If selected elements borders and menus get in the way you can toggle them with the visual helpers menu.
Check the Ignore in visual select option on individual components, if you are not interested in drilling down into them.
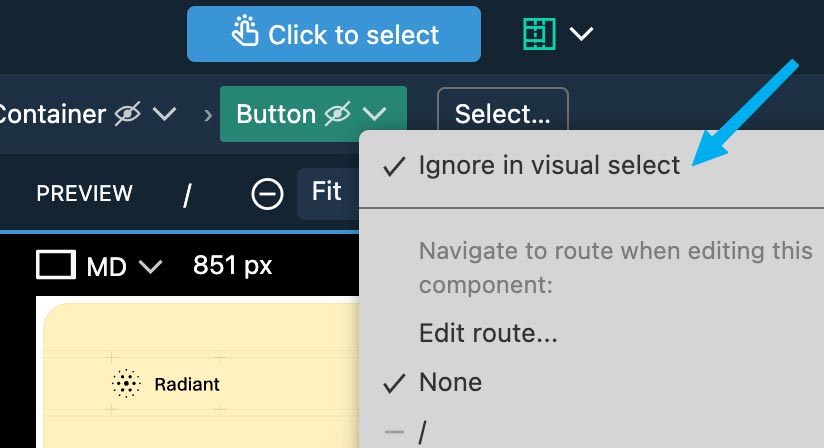
For example, clicking on the button will normally select the Button component itself in Piny and code.
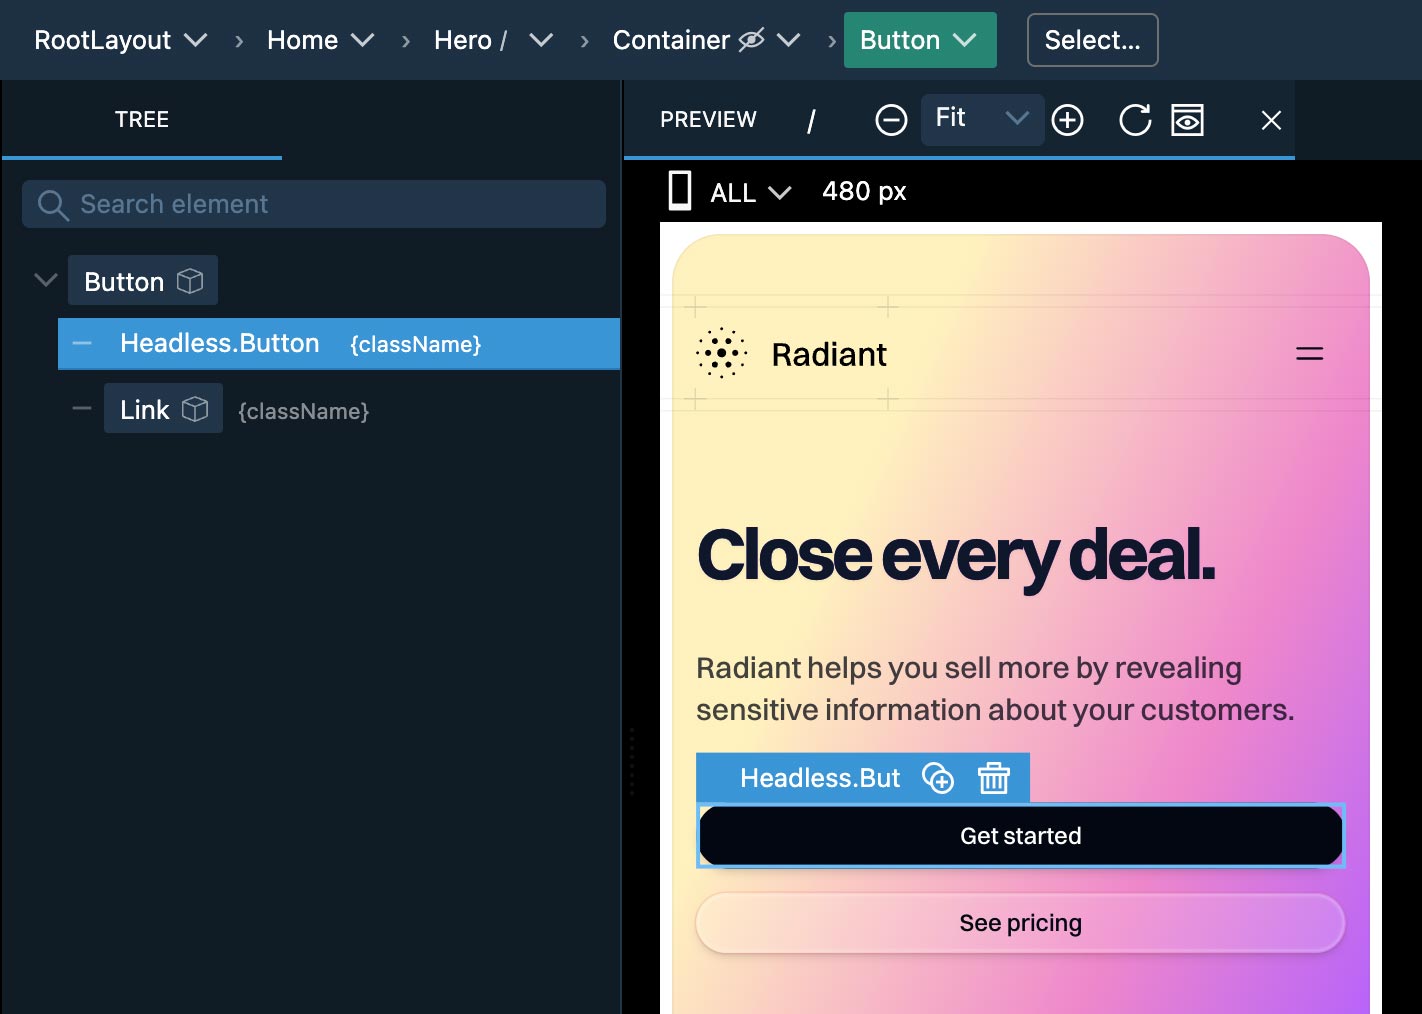
But, when Button is ignored, the instances of the button in the components where they are used will be selected instead.
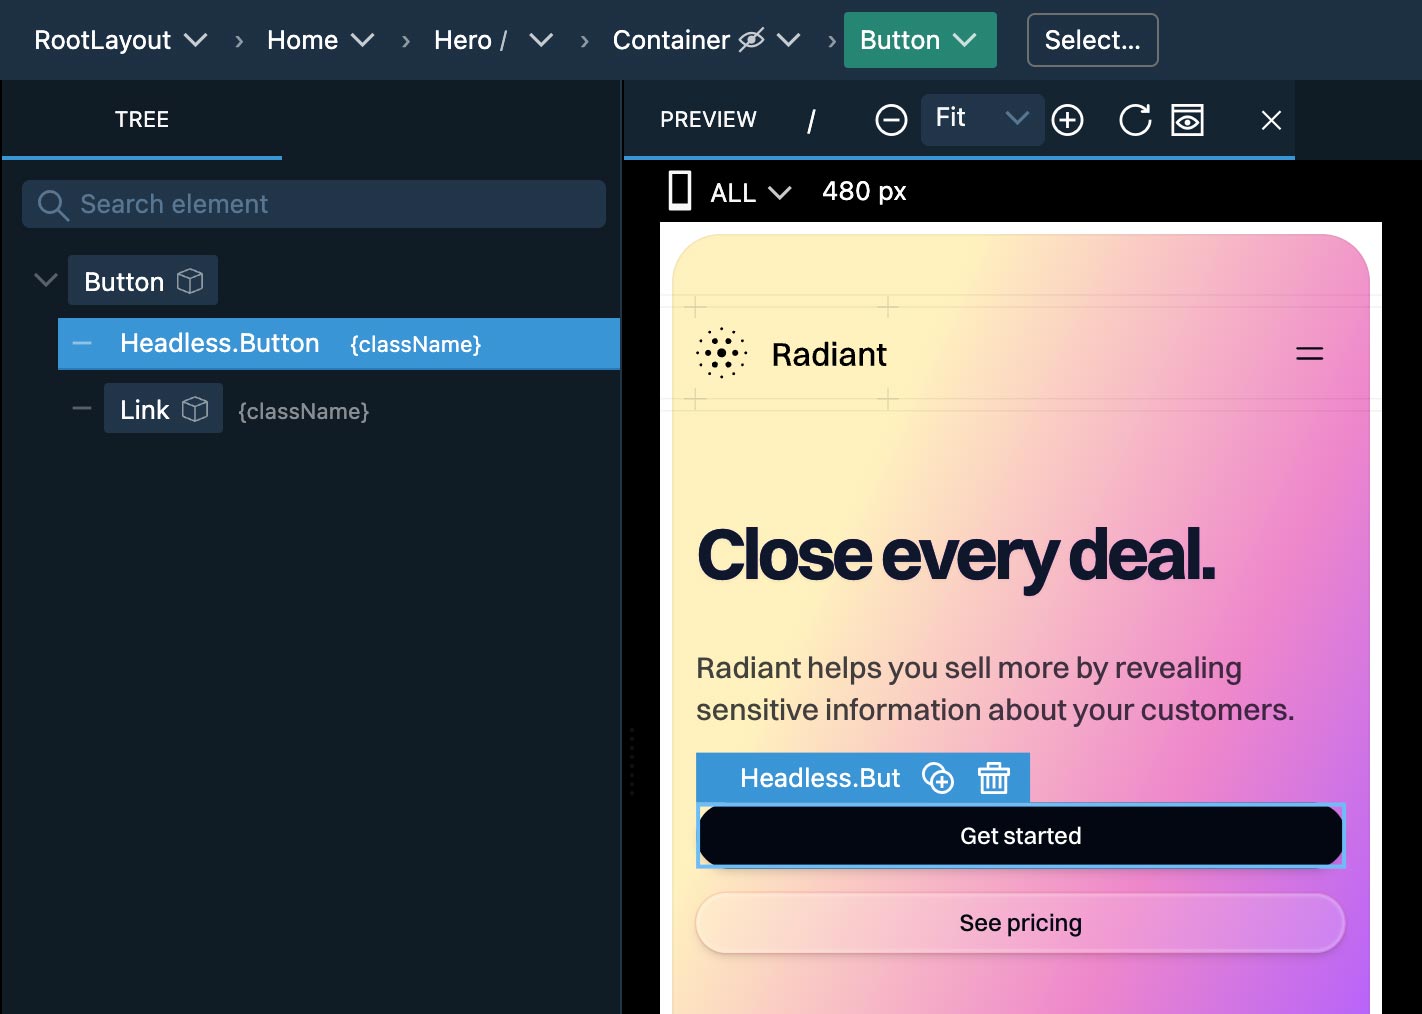
Under the hood, Visual select is doing some advanced DOM to JSX element mapping. This works even for NextJS projects where source mapping information is not always present. That’s why the mapping might not always be 100% accurate. But even in those cases, it will usually select the JSX element that is close to the correct one.
Whole Project Scan & Navigation
Piny can scan the whole project for components, so that it can recognize them during visual select.
Use the Select tool…
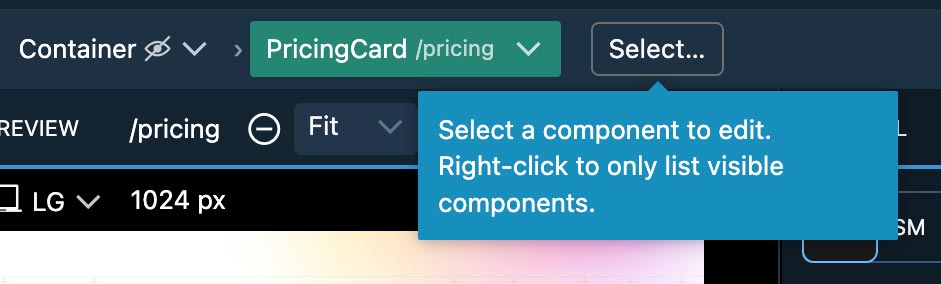
… to quickly jump to any component in the project.
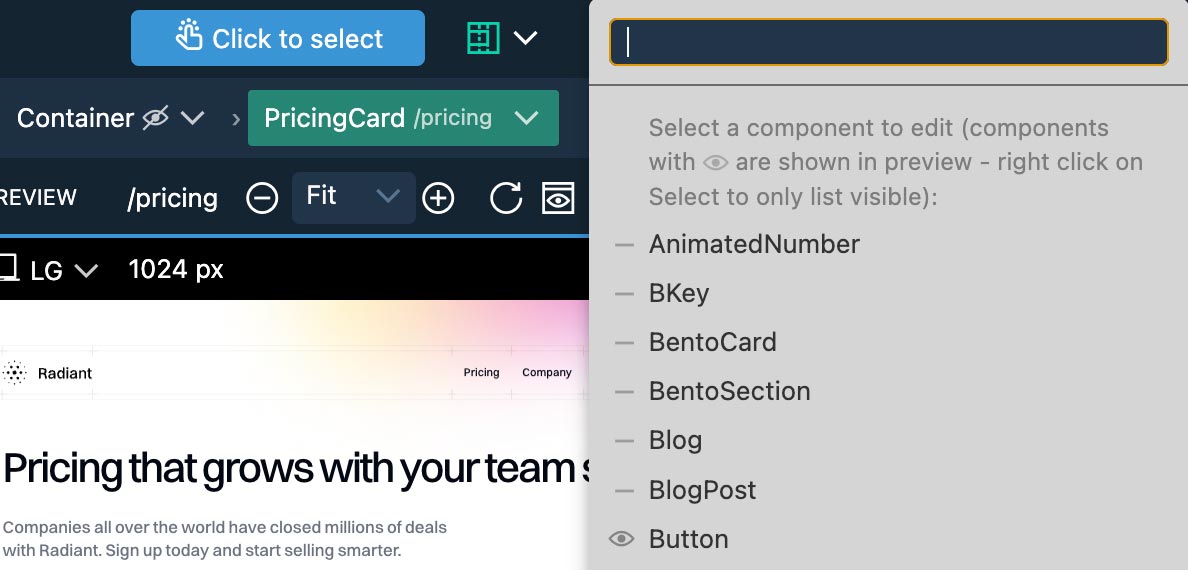
When Visual Select is active, Right-click on the Select to only display components that are visible in the preview.
Also, when Visual Select is active the top bar shows parents of the currently selected component. When Visual Select is off, the recently edited components are shown instead.
Drag & Drop tool lets you choose which component you want to add to the layout.
Import Tailwind Theme
Piny Pro can automatically import colors, fonts, breakpoints and other visual properties from your Tailwind theme.
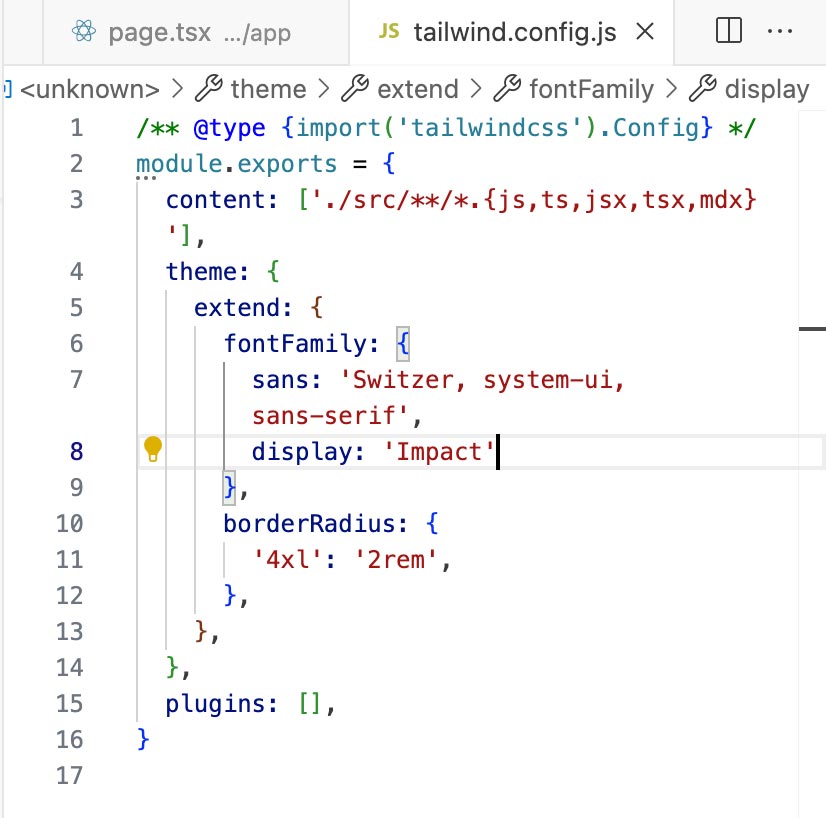
Once you point it to your Tailwind source files, Visual controls and inspector will reflect your custom theme values.
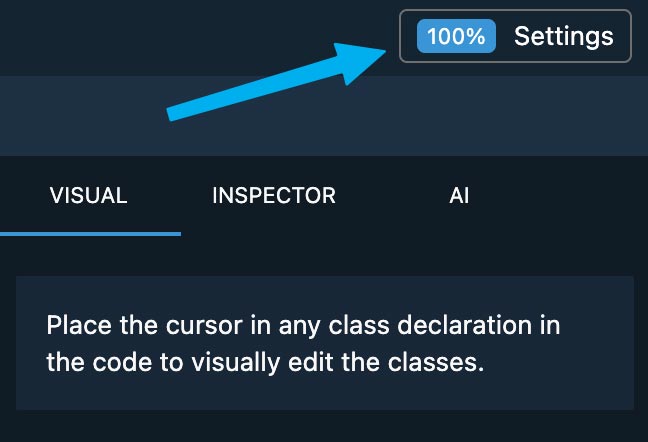
Settings
Some features require a little bit of setup.
Click on the Settings button to open the dialog.
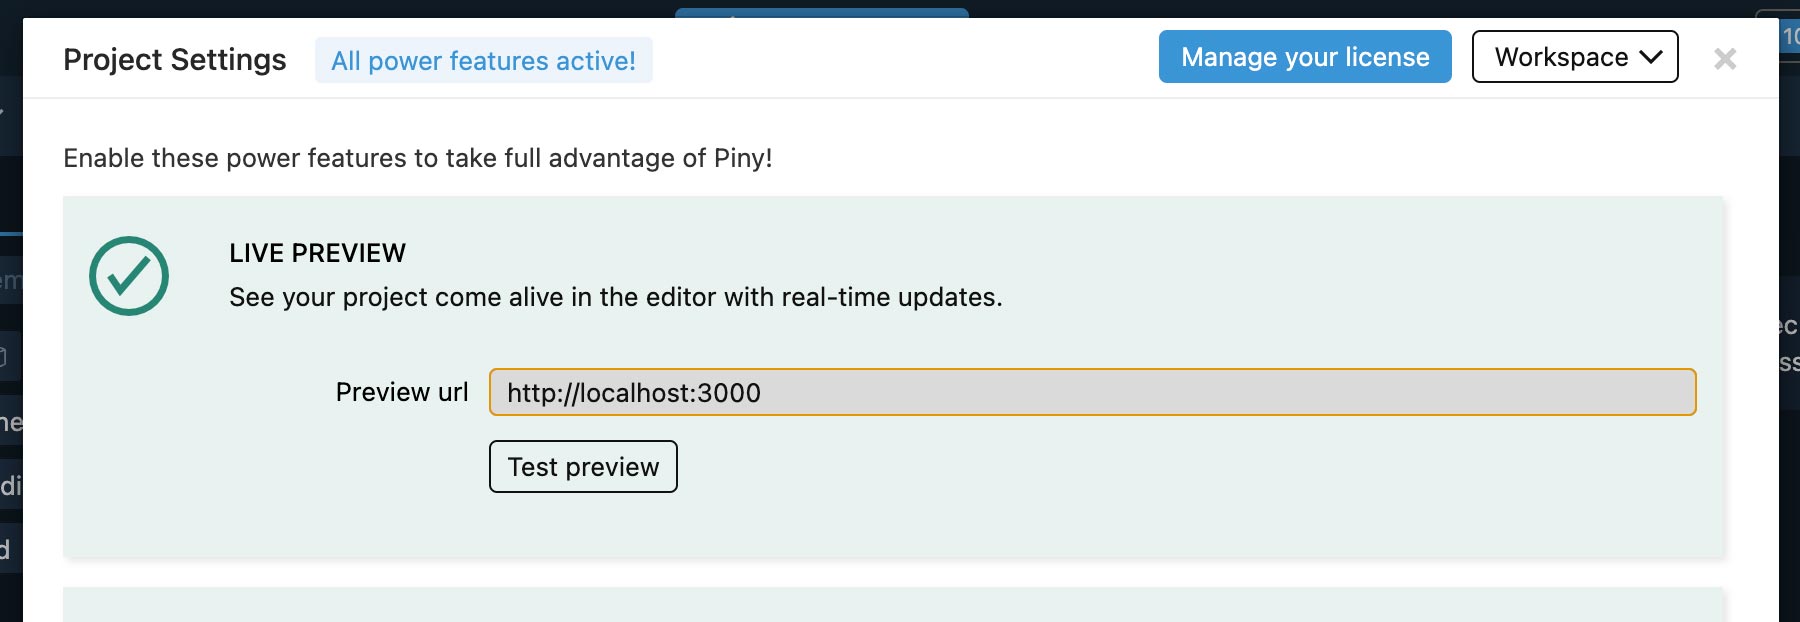
Piny tries to auto detect the URL of the development server. In rare cases where that doesn’t work, enter the URL here, under Live preview.
Piny’s AI assistant works with multiple AI providers and your own API keys. Open AI Assistant Settings to activate providers and choose a Quick and Smart models.
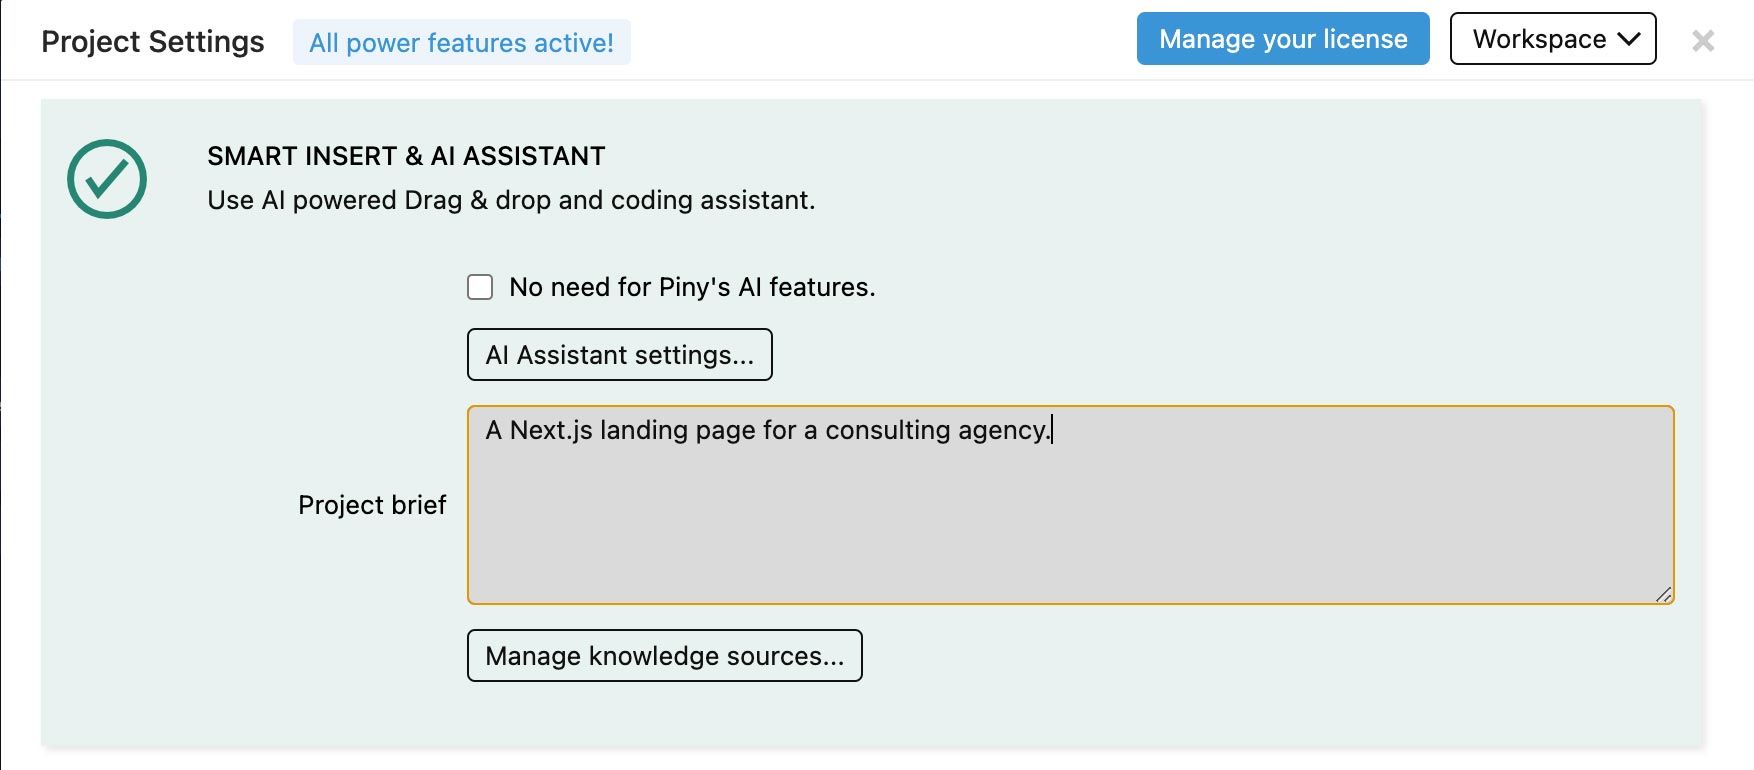
Use Project Brief field to enter any custom instructions for the current project.
You can also define Knowledge Sources that can then be included in AI Assistant prompts.
If you don’t need Piny’s AI Assistant select this checkbox and the AI panel will be hidden.
To import your custom Tailwind theme, point Piny to the Tailwind config and source file. For Tailwind 4 only the source file is required.
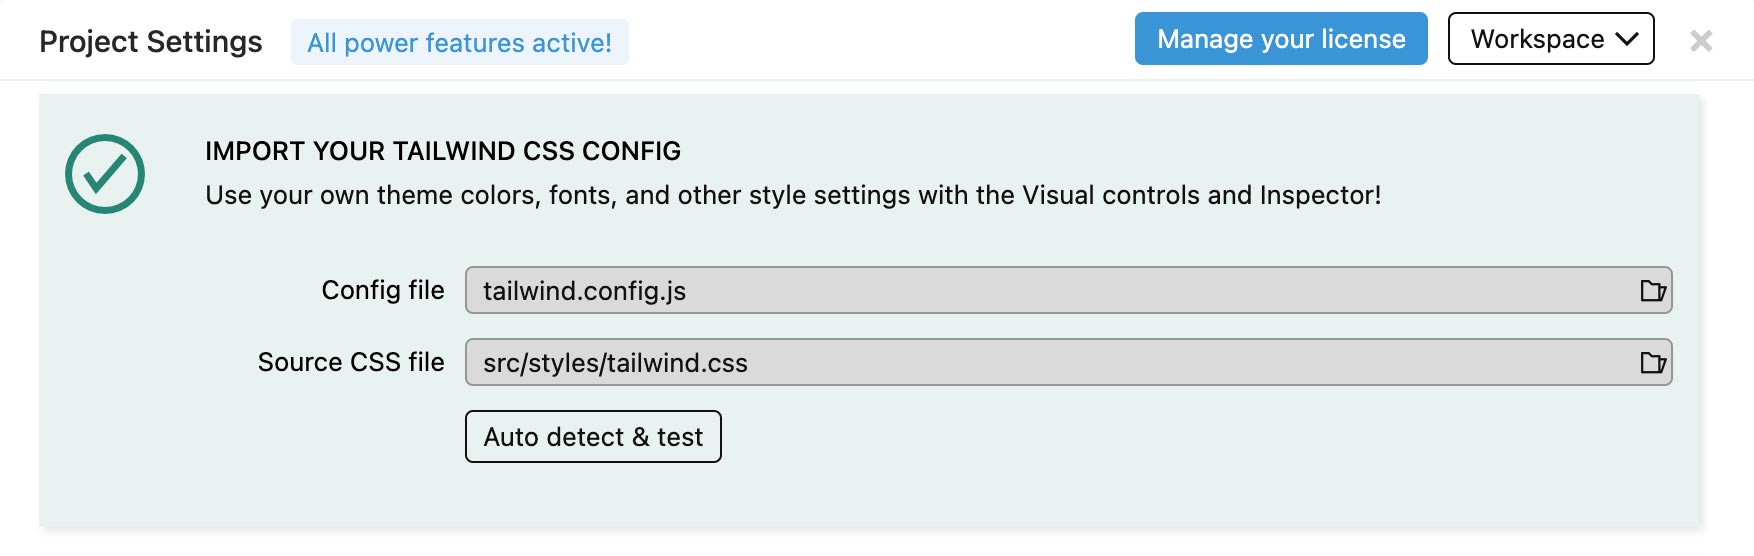
Source folders contain a list of project folders that Piny scans for components. By default, src, pages and components folders are scanned.
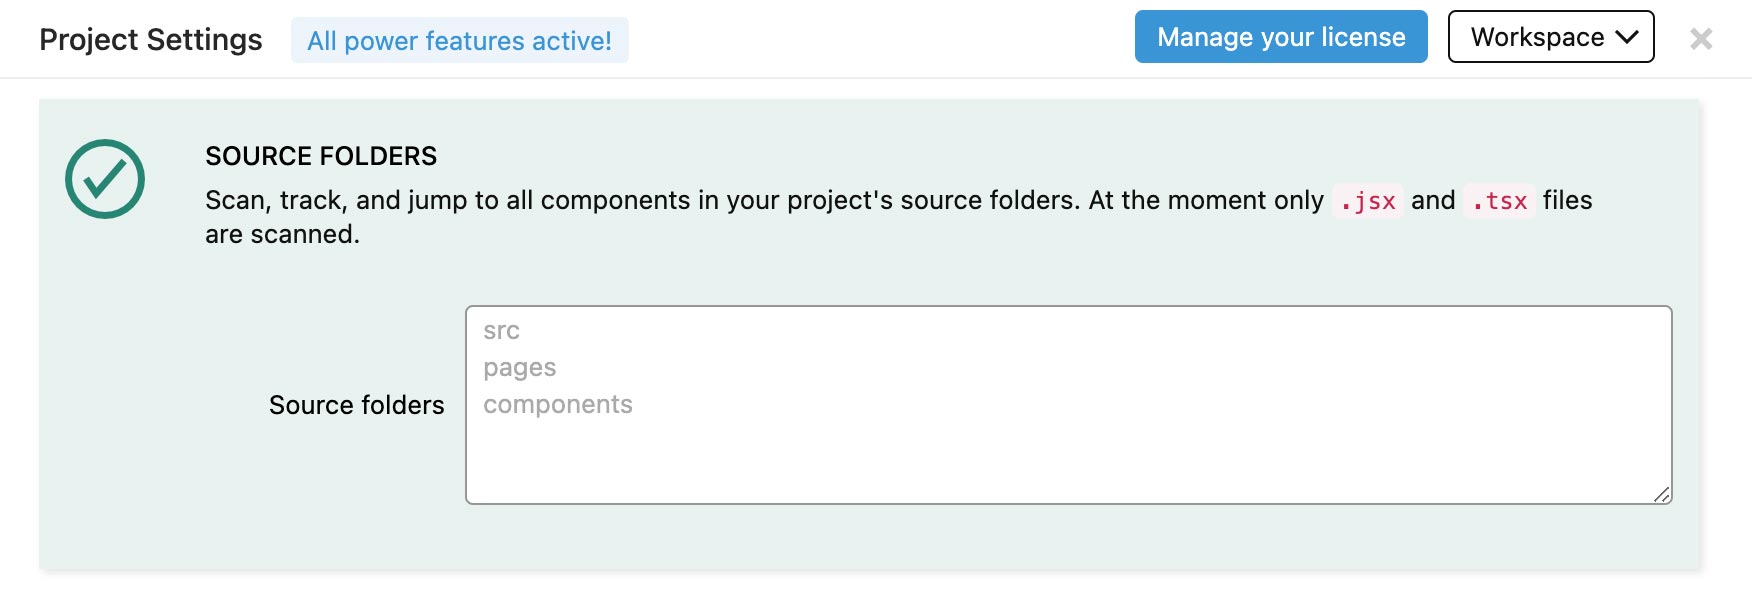
For very large projects, it makes sense to only enter specific folders that contain subset of components that you are actively working on.
Visual Select requires that a small script is included in the layout of your project.
Follow the setup instructions to do that.
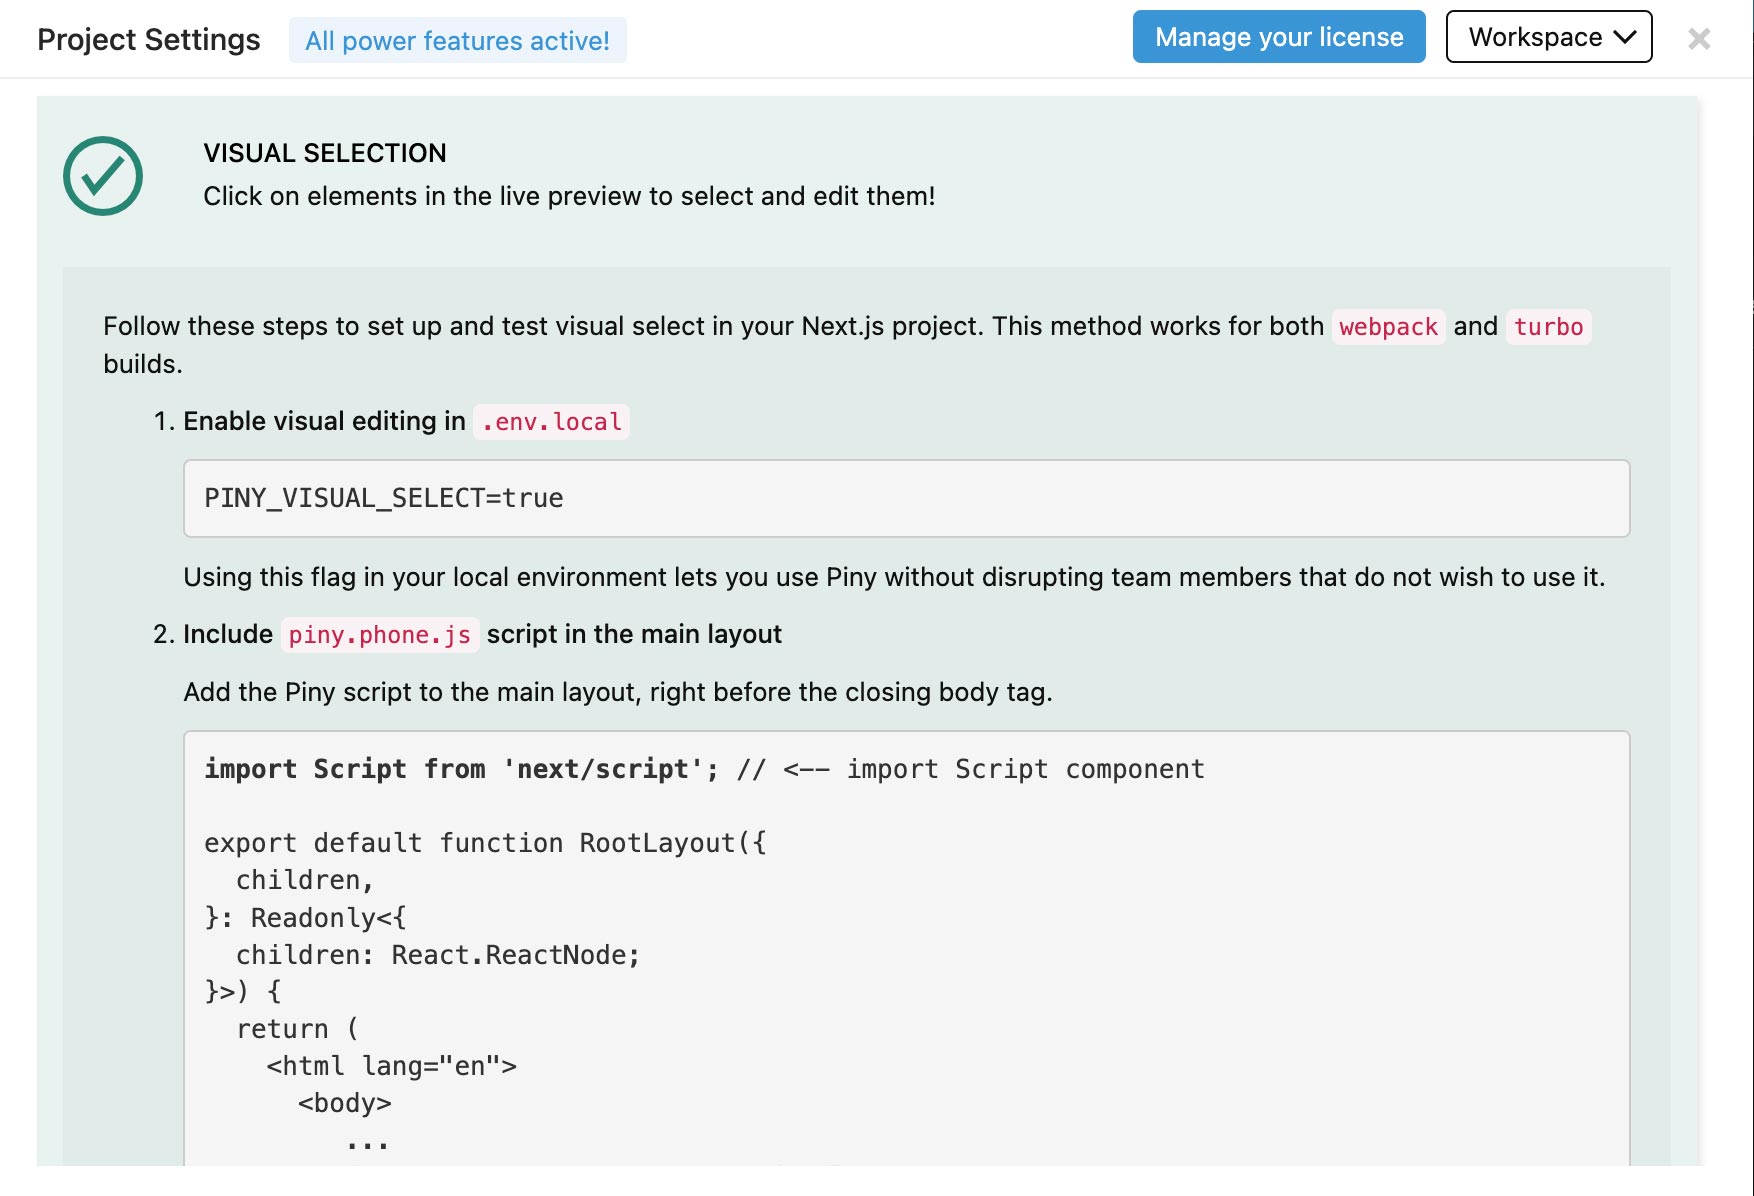
The point is to include the Piny script in the layout, but only in development mode, and to optionally toggle it with an environment setting. But even if the script is included, it is only activated when the preview runs in Piny.
Not all build methods are supported yet. Let me know what you are using so that we can prioritize implementing the support for most commonly used stacks.
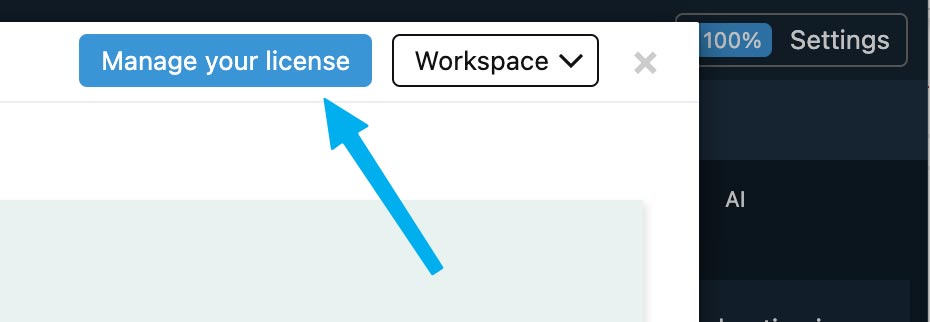
The Piny UI is fully customizable. Use the Workspace menu to save and restore panel positions. That’s also useful if the workspace gets messed up.
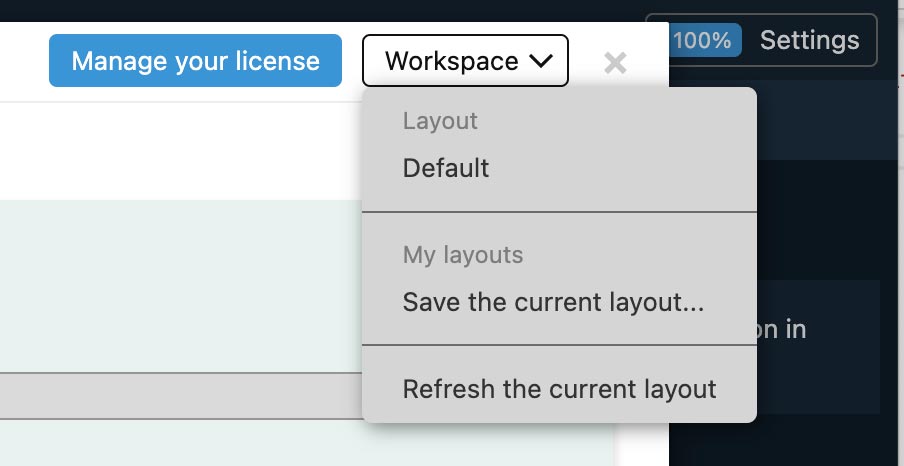
And, finally, use Manage License dialog to buy and activate your Piny PRO license.
In this section
Piny setup: before you begin
Piny runs directly in your IDE to visually edit Tailwind styling in Astro, React, and Next.js projects. Unlike Pinegrow Web Editor, Piny integrates with VS Code for dynamic…